Method and device for displaying GPS trajectory curve

A trajectory curve and display method technology, applied in the GPS field, can solve problems such as server reception, waste of server storage space, abrupt lines, etc., and achieve the effects of reducing redundant information, good display effect, and saving storage space

Inactive Publication Date: 2014-05-21
INNO INSTR (CHINA) INC
View PDF9 Cites 24 Cited by
  • Summary
  • Abstract
  • Description
  • Claims
  • Application Information

AI Technical Summary

Problems solved by technology

[0003] The existing methods for displaying historical trajectories have the following defects: when the positioning terminal has a slight jitter or a slight displacement change in place, the server w

Method used


Image

  • Method and device for displaying GPS trajectory curve
  • Method and device for displaying GPS trajectory curve
  • Method and device for displaying GPS trajectory curve

Examples


Embodiment 1

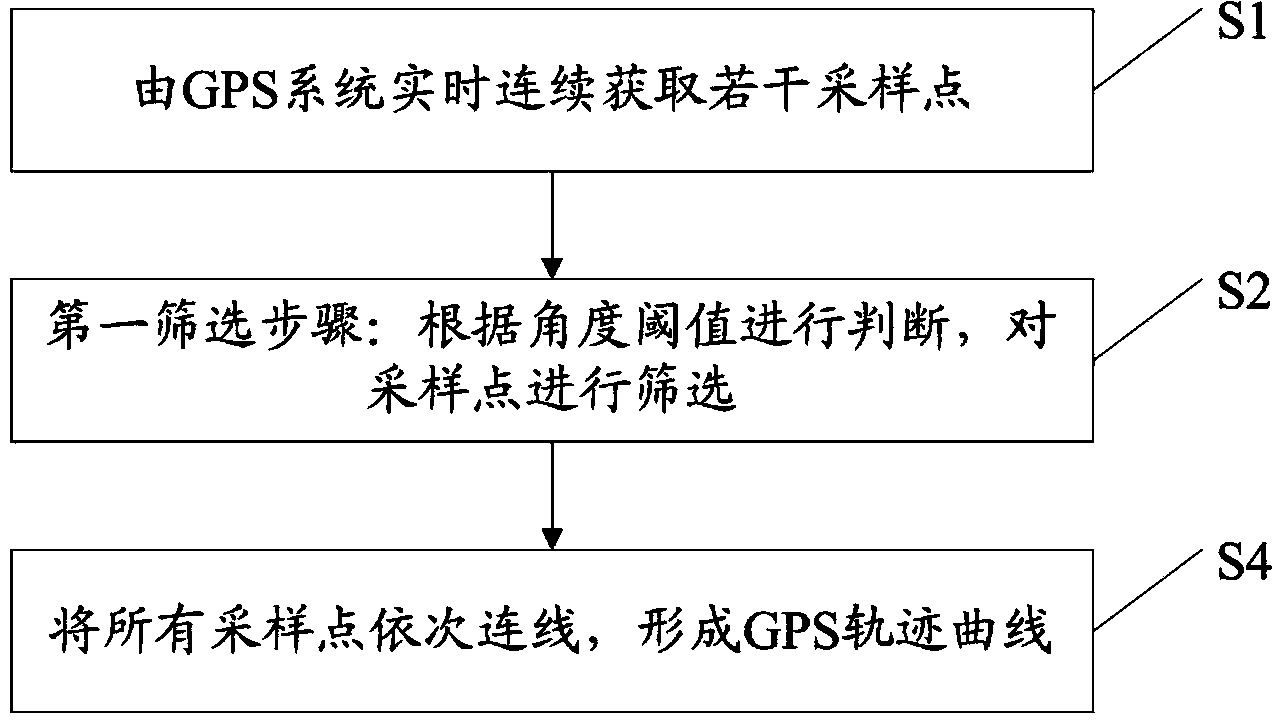
[0032] Such as figure 1 As shown, a method for displaying a GPS trajectory curve includes the following steps:

[0033] Step S1, step of acquiring sampling points: the GPS system continuously acquires several sampling points in real time; wherein each sampling point corresponds to a time value and a two-dimensional coordinate value.

[0034] In this step, obtaining several sampling points continuously means that the GPS positioning terminal uploads real-time location information data at regular intervals, and each obtained group of location information data is regarded as a sampling point. The time value corresponding to each sampling point is the current time when the positioning terminal uploads the location information data, and the two-dimensional coordinate value corresponding to each sampling point is the latitude and longitude coordinates of the current geographic location when the positioning terminal uploads the location information data. Under normal circumstances, ...

Embodiment 2

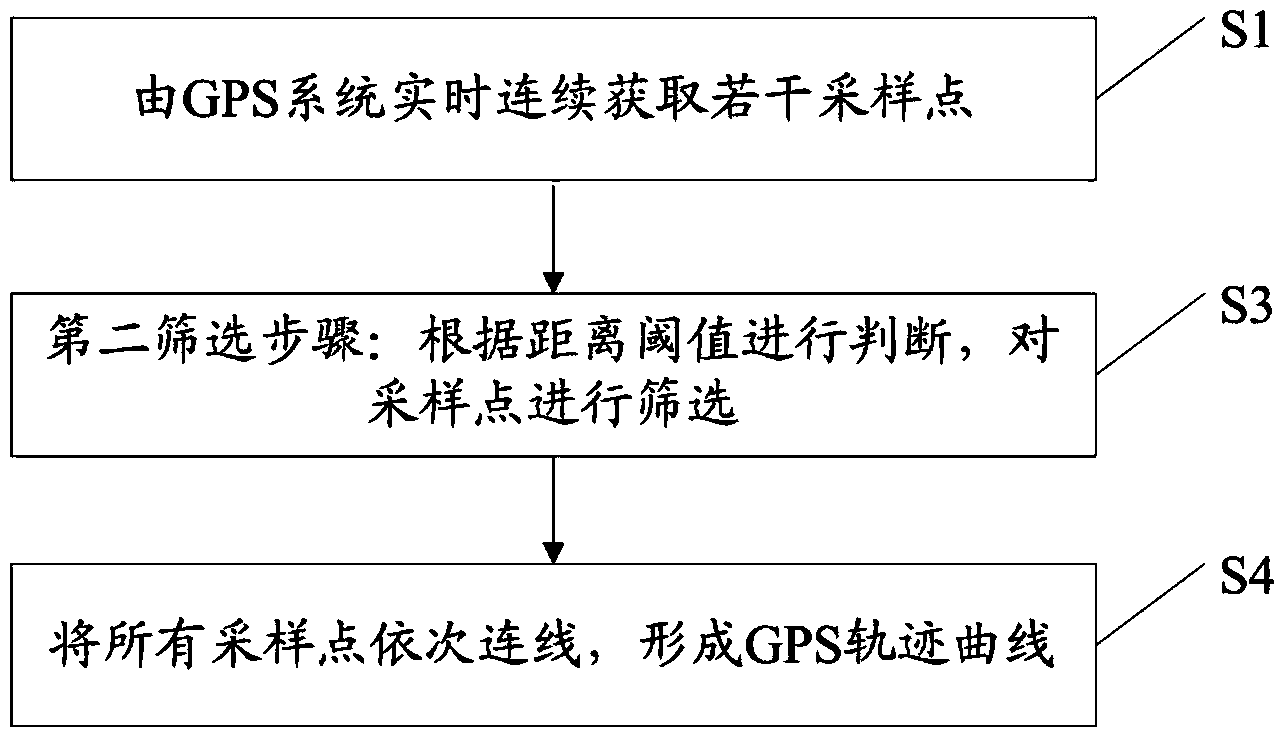
[0041] Such as image 3 As shown, a display method of a GPS trajectory curve, the difference between this embodiment and Embodiment 1 is that step S2 is not included between step S1 and step S4, step S3 is included between step S1 and step S4, and the second screening step :

[0042] Traverse all sampling points according to the order of time values; for two adjacent sampling points, calculate the straight-line distance between two adjacent sampling points; judge according to the preset distance threshold, if the straight-line distance is less than the distance Threshold, filter out the previous sampling point and keep the latter sampling point.

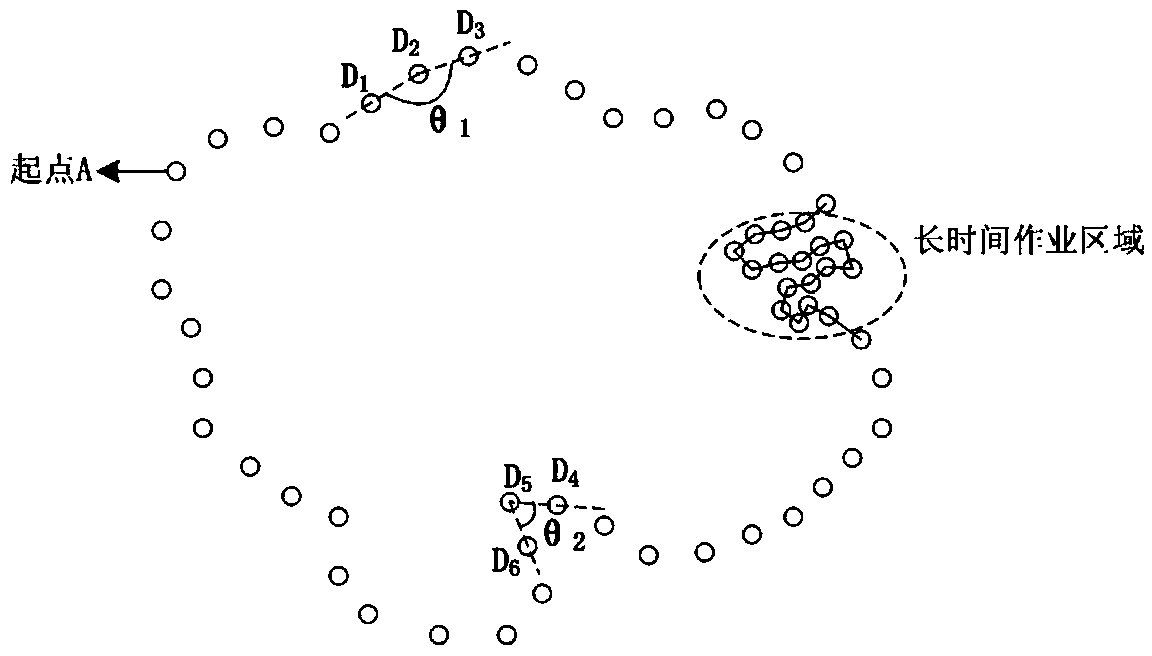
[0043]This step is aimed at the situation that the positioning terminal stays in a geographical location area within a certain range for a long time. There will be many dense points, such as figure 2 The points circled in , on the one hand, these densely distributed collection points will affect the display effect of the historic...

Embodiment 3

[0046] Such as Figure 4 As shown, a method for displaying a GPS track curve. Compared with Embodiment 1, the difference between this embodiment and Embodiment 1 is that a step S3 is also included between step S2 and step S4: a second screening step.

[0047] In this embodiment, both the first screening step and the second screening step are included, and some sampling points can be further filtered out to reduce redundant information; choose.

[0048] It should be noted that there is no strict time sequence restriction between step S2 and step S3, step S2 can be performed first and then step S3 can be performed, or step S3 can be performed first and then step S2 can be performed, both of which can achieve the corresponding technical purpose. However, it should be noted that if the processing order of the first screening step and the second screening step are exchanged, if the same distance threshold is used, the effect of the generated curve will be different, but it will no...


PUM


Abstract

The invention discloses a method for displaying a GPS (Global Positioning System) trajectory curve. The method comprises a steps of obtaining sampling points, a first screening step and/or a second screening step and a curve display step, wherein the step of obtaining the sampling points comprises obtaining a plurality of sampling points by a GPS system continuously in real time, the first screening step comprises determining according to an angle threshold and screening the sampling points, the second screening step comprises determining according to a distance threshold and screening the sampling points, and the curve display step comprises orderly connecting all the screened sampling points according to the sequence of the sampling points by time values to form the GPS trajectory curve. Compared with the prior art, the method has the advantages that sampling points are screened so that redundant information is greatly reduced and the storage space of a server is saved, and a specific screening method is used for processing so that the GPS historical trajectory curve can be well displayed.

Description

technical field [0001] The invention belongs to the technical field of GPS, and in particular relates to a display method of a GPS track curve. Background technique [0002] GPS (Global Positioning System) refers to the global positioning system, that is, a system that uses GPS positioning satellites to perform real-time positioning and navigation around the world. At present, GPS technology has been widely used in various fields. The GPS system has the function of displaying the historical trajectory, that is, the GPS system is used to obtain the location information of the positioning terminal in real time, and display the historical location trajectory of the positioning terminal on the map according to the obtained location information. In the prior art, when acquiring location information, a method of multiple consecutive uploads at a certain time interval is usually adopted, that is, the GPS module installed in the positioning terminal uploads the location information...

Claims


Application Information

Patent Timeline
IPC IPC(8): G01S19/42
CPCG01S19/37
Inventor 李胜
Owner INNO INSTR (CHINA) INC
Why Eureka
Try Eureka