Method for evaluating resistance spot welding spattering quantitatively in real time through acoustic emission signal frequency spectrum

An acoustic emission signal and resistance spot welding technology, which is applied to resistance welding equipment, measuring devices, welding equipment, etc., can solve the problems of lack of quantitative detection and evaluation methods, and the difficulty of detecting the quality of resistance spot welding solder joints, etc., to achieve fast detection and Evaluation, evaluation method is simple, practical effect

Active Publication Date: 2014-08-20
CHONGQING UNIV OF TECH
View PDF7 Cites 6 Cited by
  • Summary
  • Abstract
  • Description
  • Claims
  • Application Information

AI Technical Summary

Problems solved by technology

However, in the process of resistance spot welding, the nucleation process of the nugget cannot be directly observed, which makes it difficult to judge the influence of welding spatter and then detect the quality of resistance spot welding joints
Especially for welding spatter, a common phenomenon in the nugget nucleation process, there has been a lack of reliable quantitative detection and evaluation methods for a long time

Method used


Image

  • Method for evaluating resistance spot welding spattering quantitatively in real time through acoustic emission signal frequency spectrum
  • Method for evaluating resistance spot welding spattering quantitatively in real time through acoustic emission signal frequency spectrum
  • Method for evaluating resistance spot welding spattering quantitatively in real time through acoustic emission signal frequency spectrum

Examples


Embodiment 1

[0037] The workpiece to be welded is the overlapping joint of two galvanized steel sheet structures with a thickness of 1mm. The main welding process parameters used are: the welding current is 9000A, the duration of the welding current is 8 cycles, and the electrode pressure is 0.15MPa.

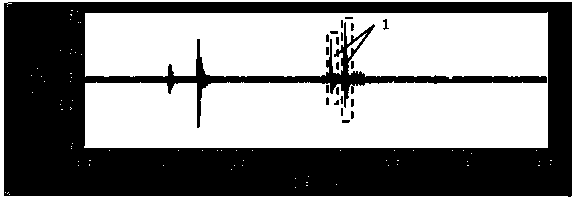
[0038] During welding, the structural load acoustic emission signal of the resistance spot welding process is collected in real time, and the dynamic curve of the structural load acoustic emission signal is drawn by the analysis software, as shown in figure 1 shown.

[0039] Different stages of the welding process can be identified from the waveform diagram, and the figure 1 Weld spatter signal 1 in the figure 2 shown. It can be seen that the mode of the welding spatter is a welding spatter event of two acoustic emission events.

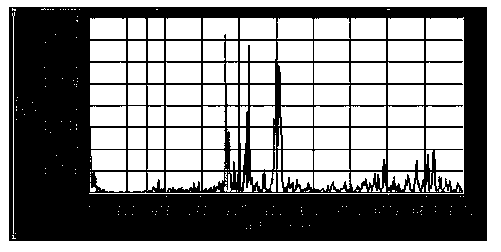
[0040] Calculate the self-power spectrum of the acoustic emission signal in the welding spatter process, and draw the self-power spectrum, such as image 3 s...

Embodiment 2

[0044] The workpiece to be welded is the overlapping joint of two galvanized steel sheet structures with a thickness of 1mm. The main welding process parameters used are: welding current is 10000A, welding current duration is 8 cycles, and electrode pressure is 0.15MPa.

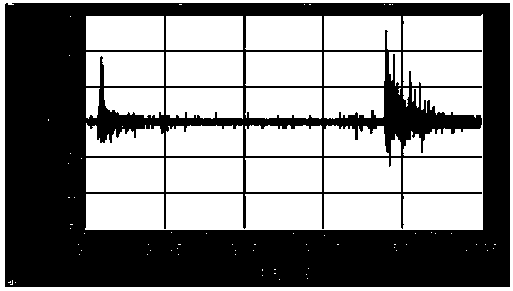
[0045] During welding, the structural load acoustic emission signal of the resistance spot welding process is collected in real time, and the dynamic curve of the structural load acoustic emission signal is drawn by the analysis software, as shown in Figure 4 shown.

[0046] Different stages of the welding process can be identified from the waveform diagram, and the Figure 4 Weld spatter signal 2 in, such as Figure 5 shown. It can be seen that the mode of the welding spatter is a welding spatter event of a single acoustic emission event.

[0047] Calculate the self-power spectrum of the acoustic emission signal in the welding spatter process, and draw the self-power spectrum, such as Figure 6 shown. ...

Embodiment 3

[0051] The workpiece to be welded is the overlapping joint of two galvanized steel sheet structures with a thickness of 1 mm. The main welding process parameters used are: welding current is 11000A, welding current duration is 8 cycles, and electrode pressure is 0.15MPa.

[0052] During welding, the structural load acoustic emission signal of the resistance spot welding process is collected in real time, and the dynamic curve of the structural load acoustic emission signal is drawn by the analysis software, as shown in Figure 7 shown.

[0053] Different stages of the welding process can be identified from the waveform diagram, and the Figure 7 Weld spatter signal 3 in, such as Figure 8 shown. It can be seen that the mode of the welding spatter is a welding spatter event of two acoustic emission events.

[0054] Calculate the self-power spectrum of the acoustic emission signal in the welding spatter process, and draw the self-power spectrum, such as Figure 9 shown.

...


PUM

PropertyMeasurementUnit
thicknessaaaaaaaaaa

Abstract

The invention discloses a method for evaluating resistance spot welding spattering quantitatively in real time through acoustic emission signal frequency spectrum. The method comprises the following steps that structure load acoustic emission signals in the resistance spot welding process are collected in real time, and a dynamic oscillogram of the signals is drawn; acoustic emission signals of welding spattering are extracted according to the dynamic oscillogram of the structure load acoustic emission signals in the resistance spot welding process; the frequency spectrum of the acoustic emission signals in the welding spattering process is calculated, and a spectrogram is drawn; frequency spectrum lines with the frequency ranging from 1800 HZ to 2600 HZ are extracted through a band-pass filter; the arithmetic mean value of three maximum peak values of the frequency spectrum lines with the frequency ranging from 1800 HZ to 2600 HZ is calculated; according to the judgment rules of quantitative evaluation of the amount of welding spattering, the larger the arithmetic mean value of the three maximum peak values of the frequency spectrum lines with the frequency ranging from 1800 HZ to 2600 HZ is, the larger the amount of the spattering in the resistance spot welding process is. Analytical calculation of the frequency spectrum can be carried out through both power spectrum and amplitude spectrum. Through the method for evaluating resistance spot welding spattering quantitatively in real time through the acoustic emission signal frequency spectrum, the quantitative evaluation of the amount of spattering in the resistance spot welding spattering process can be achieved.

Description

technical field [0001] The invention relates to a method for evaluating spatter in resistance spot welding, which is suitable for detection of spatter in resistance spot welding of commonly used metal sheet structural materials. Background technique [0002] Resistance spot welding is a welding method widely used in automobile manufacturing. There are about 3000-6000 resistance spot welding spots on a modern car. Therefore, the detection of the quality of resistance spot welding solder joints is very important. High-efficiency solder joint quality sensing and its detection and evaluation during the welding process are of great significance for optimizing the production process, improving production efficiency and welding quality. Welding spatter is a common phenomenon in resistance spot welding of metal materials. It is caused by the nucleation of the connection interface due to the melting of the material by the welding current, and the rapid expansion of the nugget...

Claims


Application Information

Patent Timeline
Patent Type & Authority Applications(China)
IPC IPC(8): G01H17/00G06F19/00B23K11/11
Inventor 罗怡
Owner CHONGQING UNIV OF TECH
Why Eureka
Try Eureka