Power distribution visualization system based on EXCEL

A power distribution network and document technology, applied in the field of power distribution visualization system based on EXCEL, can solve the problems of failure to notify users of power outages in time, long power outage time, waste of time and manpower, etc., to shorten power outage time and reduce workload , the effect of improving work efficiency

Inactive Publication Date: 2014-12-03
STATE GRID CORP OF CHINA +1
View PDF1 Cites 3 Cited by
  • Summary
  • Abstract
  • Description
  • Claims
  • Application Information

AI Technical Summary

Problems solved by technology

Based on the above-mentioned processing method, it takes a long time to notify the fault maintenance personnel, so that the power outage time is longer; the situation of the power outage area that occurs when a fault occurs is not so clear at a glance, so that the user cannot be notified of the power outage in time; inspections are often When a fault occurs in an area, it is necessary to check the previous fault records, which is a waste of time and manpower

Method used


Image

  • Power distribution visualization system based on EXCEL
  • Power distribution visualization system based on EXCEL
  • Power distribution visualization system based on EXCEL

Examples


Embodiment Construction

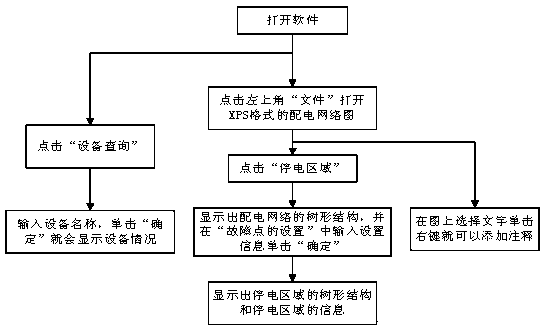
[0016] Take a distribution network diagram of a company as an example for analysis. First, the relationship between the parent node and the child node is determined according to the distribution nodes in the distribution network diagram, that is, the key information in the electrical tree structure diagram based on the XPS format is mined. Secondly, enter these key information into relevant EXCEL files; finally, establish a power distribution visualization system based on EXCEL files, which can display fault information and equipment status information. The following are the specific implementation details of each part.

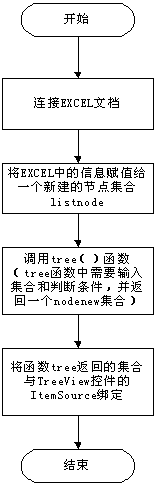
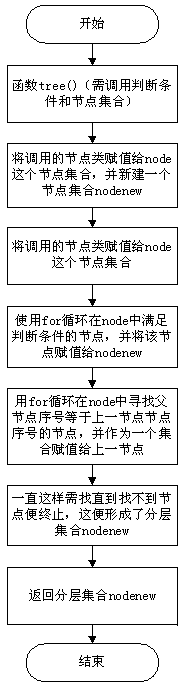
[0017] 1) The storage method of each node information in the distribution network diagram. To obtain a tree structure diagram of a power distribution network, it is first necessary to mine the information of each node in the power distribution network diagram, and put the information in an EXCEL file with the same name as the power distribution network diagr...


PUM


Abstract

The invention provides a power distribution visualization system based on the EXCEL. Firstly, the relationship among all nodes of a power distribution network diagram is observed, and then information of the nodes is stored in an EXCEL file corresponding to the power distribution network diagram according to the relationship among father nodes and child nodes; then the EXCEL file is connected with software, a tree structure of all the nodes of the power distribution network diagram can be displayed by pressing a feature button, fault node names and a fault module are input, the fault module can display the tree structure diagram of the power failure area and information of all nodes of the power failure area and can store the information in a specified EXCEL file, and when the fault history of a certain node needs to be looked up, only the node name needs to be input, and the past fault situation of the node can be displayed; by means of the visualization system, the fault maintenance personnel can be informed to conduct fault removal and power recover effectively and timely, the outage time is shortened, and economical benefits are greatly improved while requirements of users are met.

Description

technical field [0001] The invention belongs to the field of distribution network management, in particular to an EXCEL-based power distribution visualization system. Background technique [0002] With the development of social economy and the improvement of living standards, people have higher and higher requirements on the quality of power supply. At the same time, the scale and complexity of distribution network are also increasing year by year. All of these pose greater challenges to the requirements of power supply stability and timeliness of fault resolution. When a fault occurs in the traditional power distribution network, the operating personnel will first search for the contact number of the maintenance personnel at the location of the fault according to the location of the fault, and then contact the maintenance personnel. This will take a certain amount of time and increase the power outage time. At the same time, if you want to notify users of the power outage,...

Claims


Application Information

Patent Timeline
Patent Type & Authority Applications(China)
IPC IPC(8): G06Q50/06
CPCY04S10/50
Inventor 何江涛赵行龙飞黄雪昀成涛
Owner STATE GRID CORP OF CHINA
Why Eureka
Try Eureka