Power grid visualization method based on plugins

A power grid and plug-in technology, applied in the field of power grid visualization and power grid visualization based on plug-ins, to achieve the effect of improving scalability

Inactive Publication Date: 2014-12-24
STATE GRID CORP OF CHINA +3
View PDF9 Cites 17 Cited by
  • Summary
  • Abstract
  • Description
  • Claims
  • Application Information

AI Technical Summary

Problems solved by technology

This method mainly implements the call process between the plug-in and the platform, and does not make specific instructions on how to realize grid visualization through the cooperation of the plug-in

Method used


Image

  • Power grid visualization method based on plugins
  • Power grid visualization method based on plugins

Examples


Embodiment Construction

[0026] The technical content of the present invention will be further described in detail below in conjunction with the accompanying drawings and specific embodiments.

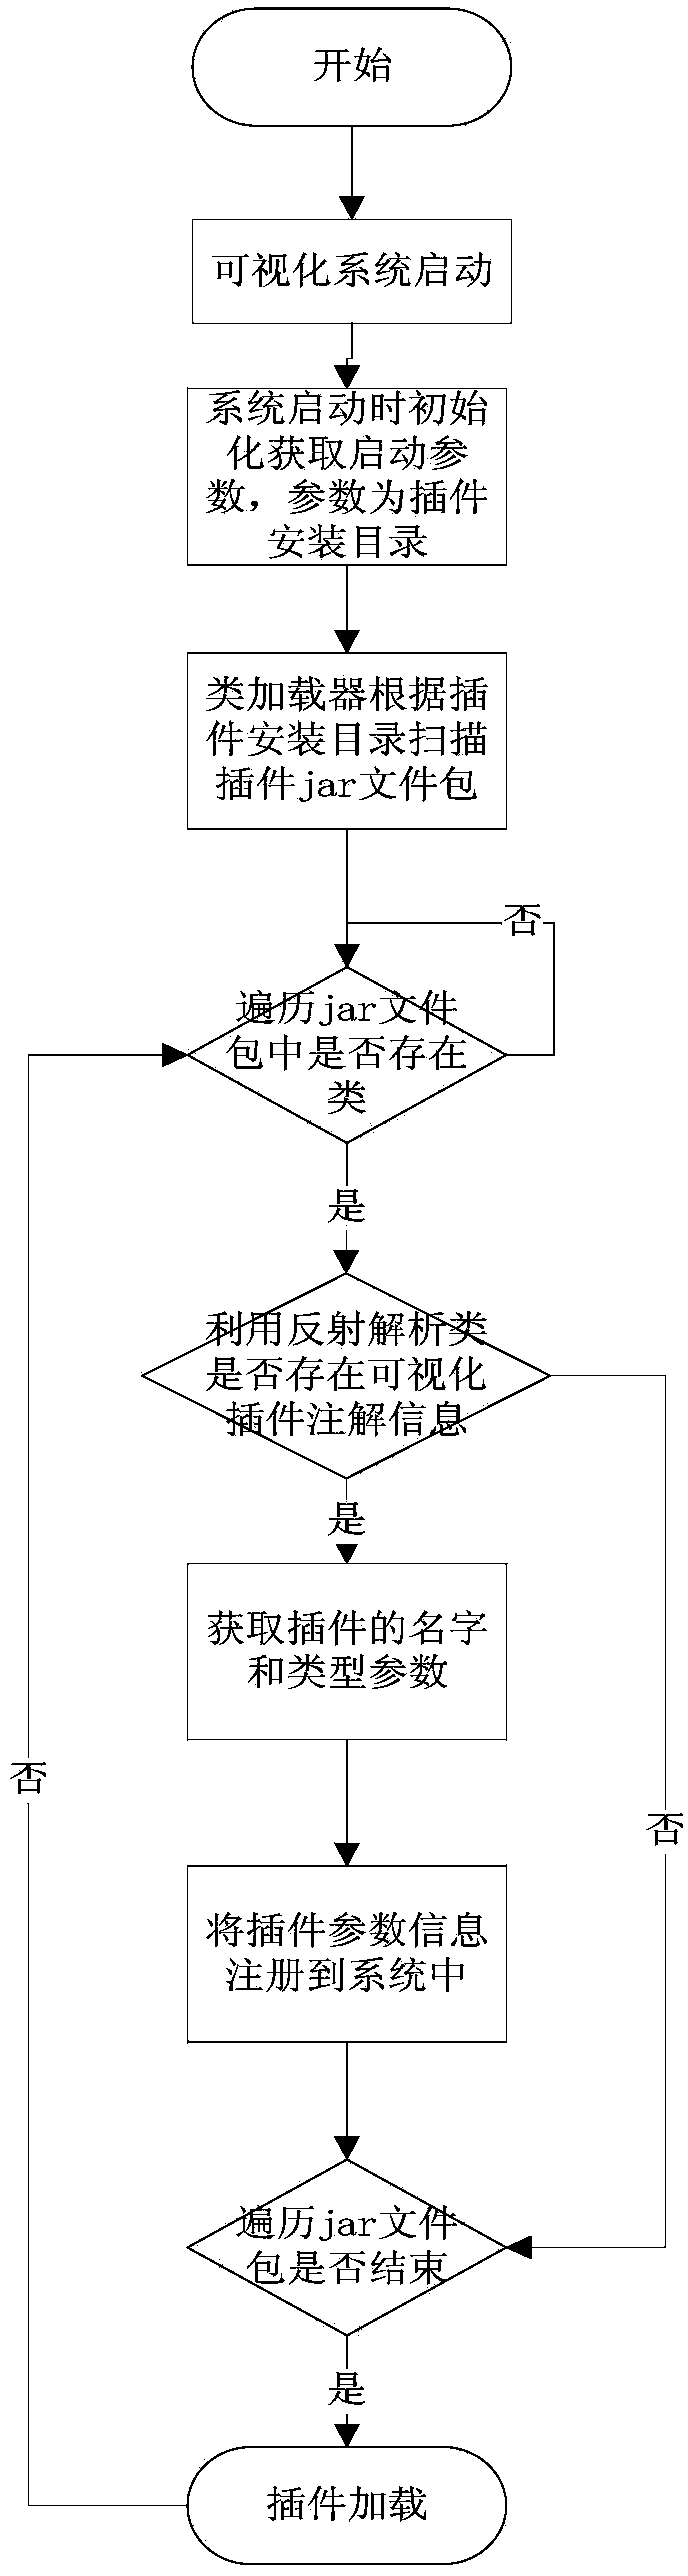
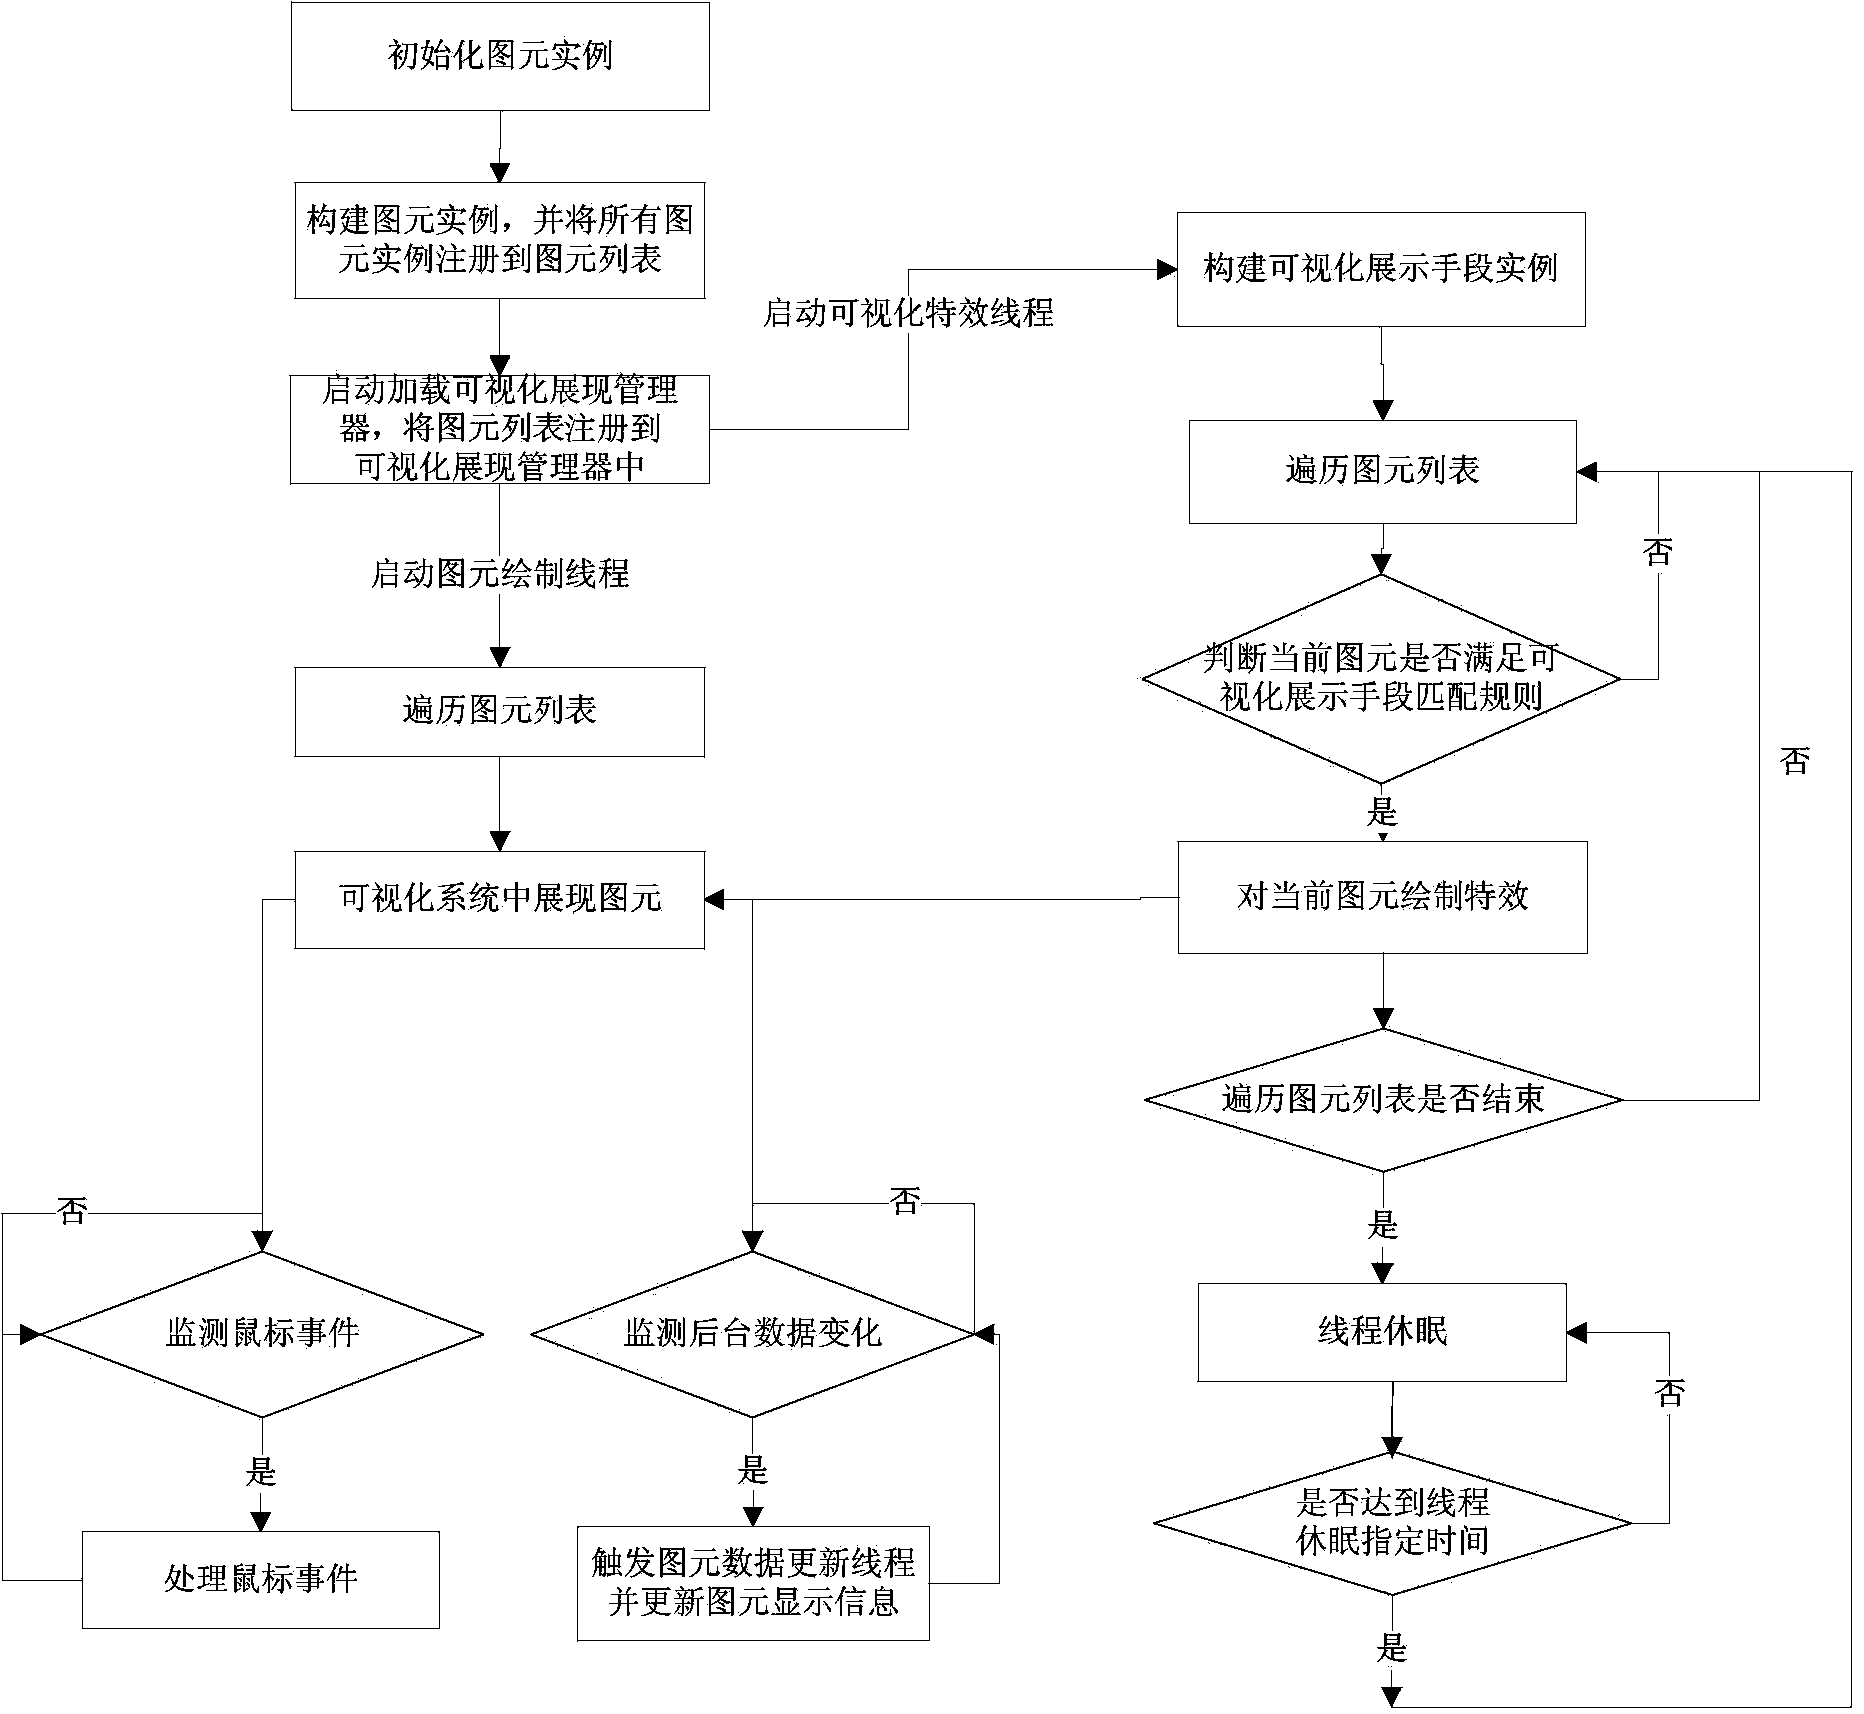
[0027] The power grid visualization method provided by the present invention is based on the plug-in design principle, combined with a unified visualization framework, and establishes a unified plug-in structure for image display in the power grid visualization system. According to the types and characteristics, implementation mechanisms and usage methods of visual primitives and visual special effects, the main links such as graphic drawing, image rendering, data association, editing configuration, data calculation, etc. are refined and disassembled, so that the plug-in realizes a unified standard interface. As long as it conforms to the standard interface, it can be dynamically loaded into the power grid visualization system in the form of a graphics plug-in, and then be correctly parsed, drawn and rendered ...


PUM


Abstract

The invention discloses a power grid visualization method based on plugins. The method comprises the following steps that a power grid visualization system is started, and a primitive plugin and a visualization special effect plugin register to the power grid visualization system; primitive instances of the primitive plugin are initialized, and primitive files are generated; according to the primitive files, the primitive instances are constructed, and all the primitive instances register to a primitive list; after the primitive list registers, a visualization special effect thread and a primitive drawing thread are triggered; the primitive drawing thread draws primitives in the primitive list, and visualization special effects are overlapped by the visualization special effect thread according to the primitives sequentially arranged in the primitive list. A unified standard interface is adopted by the primitive plugin and the visualization special effect plugin, the plugins conforming to the standard interface can be dynamically loaded into the power grid visualization system, and therefore the expandability, openness and maintainability of the power grid visualization system are improved.

Description

technical field [0001] The invention relates to a power grid visualization method, in particular to a plug-in-based power grid visualization method, and belongs to the technical field of power system dispatching. Background technique [0002] The power grid visualization system is a module for the smart grid dispatching technical support system to interact with users, including a visual application interface and an intermediate data service layer. The visual application interface is an interface that directly interacts with the user, including screen editing, pixel editing, graphic element editing, and screen browsing. The visual application interface interacts with the intermediate data service layer, and realizes the interaction between the visual view and the data model through the interface of the intermediate data service layer. [0003] "Platform + plug-in" is a structure that can make the software expand flexibly. One part is the main body or main framework of the p...

Claims


Application Information

Patent Timeline
Patent Type & Authority Applications(China)
IPC IPC(8): G06Q50/06
Inventor 王文梁陕鹏杨立波尚学伟习新奎张亮李一鹏马斌沈国辉马忠佳赵春光苏琳琳
Owner STATE GRID CORP OF CHINA
Why Eureka
Try Eureka