
Multi-spectral remote sensing image change detection method based on spectral reflectivity neighborhood difference chart and neighborhood probability fusion

A spectral reflectance and change detection technology, applied in image enhancement, image analysis, image data processing, etc., can solve problems such as not considering pixel neighborhood information, missed detection, unsatisfactory change detection results, etc.

Inactive Publication Date: 2015-03-25
XIDIAN UNIV
View PDF3 Cites 13 Cited by
  • Summary
  • Abstract
  • Description
  • Claims
  • Application Information

AI Technical Summary

Problems solved by technology

However, when this method is applied to multispectral images, due to the lack of band information, the difference between the corresponding ground and object spectral vectors between different time phase images is not large enough. Therefore, the change detection results obtained by classifying the difference images obtained by the SAM method In , although the pseudo-change information is reduced, a lot of missed detections are introduced at the same time
[0004] The above-mentioned change detection methods all use the spectral information of the image, and do not consider the neighborhood information of the pixel, making the change detection results unsatisfactory.

Method used


Image

  • Multi-spectral remote sensing image change detection method based on spectral reflectivity neighborhood difference chart and neighborhood probability fusion
  • Multi-spectral remote sensing image change detection method based on spectral reflectivity neighborhood difference chart and neighborhood probability fusion
  • Multi-spectral remote sensing image change detection method based on spectral reflectivity neighborhood difference chart and neighborhood probability fusion

Examples


Embodiment Construction

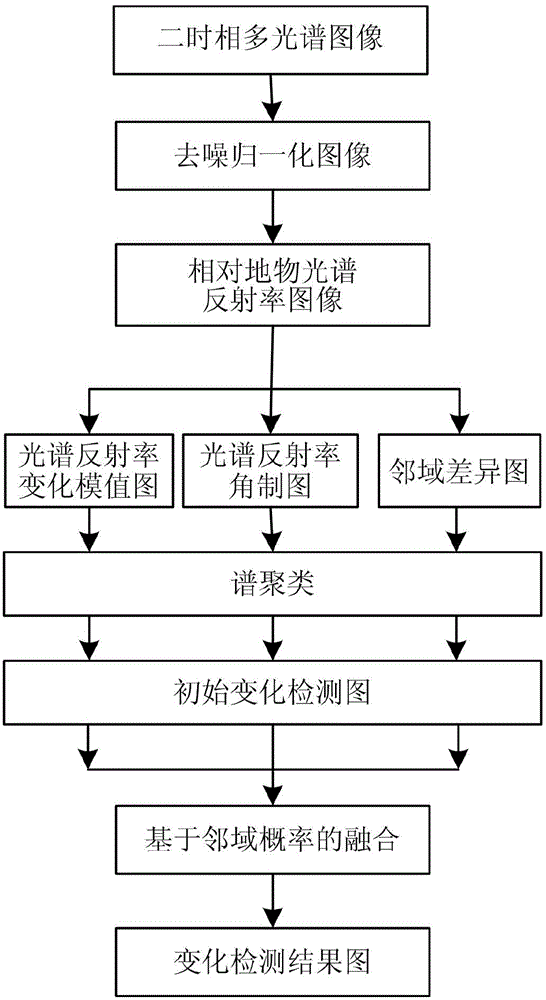
[0052] Reference figure 1 , The implementation steps of the present invention are as follows:

[0053] Step 1. Input two multispectral image sets I of the same area acquired in two time phases 1 And I 2 .

[0054] Enter two sets of multispectral images of the same area acquired at two time phases: I 1 ={A 1 b } And I 2 ={A 2 b }, where A t b Is each single-band image in two multispectral image sets, the superscript b represents the band number, b=1, 2,...,B, B is the total number of bands, the subscript t is the time phase number, t={ 1,2}, each single-band image A t b Both are composed of m rows and n columns of pixels.

[0055] Step 2. For two temporal multispectral image sets I 1 And I 2 Respectively perform Wiener filter denoising and normalization processing to obtain a normalized image set with

[0056] 2.1) The two-phase multispectral image set I 1 And I 2 Each image in A t b Convert the gray value interval from 0 to 255 to 0 to 1, and then use the Wiener filter with a window...


PUM


Abstract

The invention discloses a multi-spectral remote sensing image change detection method based on a spectral reflectivity neighborhood difference chart and neighborhood probability fusion. The method mainly comprises the steps that 1, a registered two-time-phase multi-spectral image set at the same area is input and is subjected to Wiener filtering noise reduction and normalization processing; 2, the processed image set is converted into a relative ground object spectral reflectivity image set; 3, the spectral reflectivity change module value is calculated, and a spectral reflectivity change module value chart is obtained; 4, the spectral reflectivity angle value is calculated, and a spectral reflectivity angle value chart is obtained; 5, a neighborhood difference value of the spectral reflectivity is calculated and the neighborhood difference chart is obtained; 6, clustering is carried out on the spectral reflectivity change module value chart, the spectral reflectivity angle chart and the neighborhood difference chart, and a binary image is obtained; 7, the obtained binary image is fused based on the neighborhood probability, and a change detection result chart is obtained. Manual participation is not needed, the detection precision is high, and the method can be used for the fields such as urban expansion monitoring, forest and vegetation change monitoring and the like.

Description

Technical field [0001] The invention belongs to the technical field of optical remote sensing image processing, and is specifically a multi-spectral remote sensing image change detection method based on spectral reflectance neighborhood difference map and neighborhood probability fusion, which can be used for change monitoring of land use, vegetation coverage and the like. Background technique [0002] The change detection of remote sensing images is the process of identifying changes in the state of objects or changes in phenomena by analyzing and extracting differences in electromagnetic spectrum characteristics or spatial structure characteristics between remote sensing images of different time phases in the same area. It has been widely used in many fields of national economy and national defense construction, such as agricultural survey, forest and vegetation change monitoring. Since the changes of different feature types may be reflected in different spectral ranges, and mu...

Claims


Application Information

Patent Timeline
IPC IPC(8): G06T7/00
CPCG06T7/0002G06T2207/10036G06T2207/30168
Inventor 王桂婷焦李成蒋俊霄公茂果侯彪钟桦王爽张小华田小林
Owner XIDIAN UNIV
Learn More