A Phase Diagram Matrix Method for Nonlinear Dynamic Behavior Analysis
A non-linear dynamics and behavior analysis technology, applied in the field of data recognition, it can solve the problem that ergodicity cannot be quantitatively analyzed, and achieve the effect of improving the speed of identification and the calculation process.
- Summary
- Abstract
- Description
- Claims
- Application Information
AI Technical Summary
Problems solved by technology
Method used
Image
Examples
Embodiment 1
[0047] The equation of the Duffing system is:
[0048]
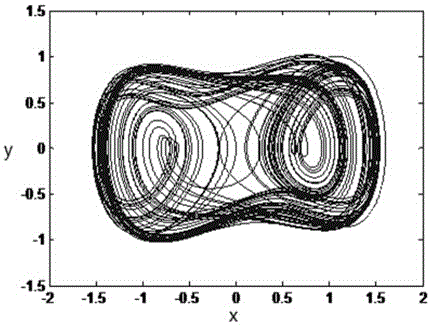
[0049] Where δ≥0 is the damping coefficient, and γ is the amplitude of the built-in periodic driving force. The equation behaves as a chaotic state under some parameter values. The existing methods of judging the state of the system by using the change of the phase trajectory mainly determine the state of the system by observing the phase trajectory of the system. This method is very dependent on people's subjective cognition, there is no quantitative standard, the generality is not good, and the operability is not high.
[0050] The specific operation steps of using this method to judge the system status are as follows:
[0051]The first step, after setting the parameters in the system to ω=1, δ=0.5, γ=0.66, and the system calculation step size h=0.01 seconds, regard the system displacement time series as x and velocity time series as y, The state of the Duffing system at a certain moment is (x, y), and a time ser...
Embodiment 2
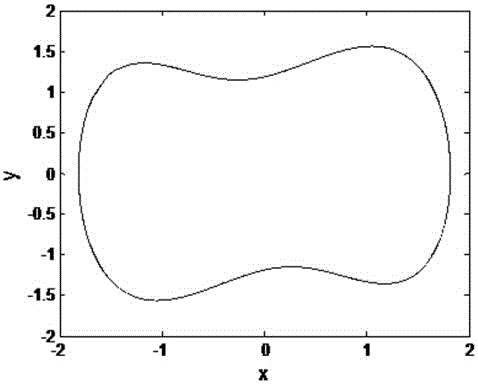
[0066] The difference from Example 1 is that γ in the Duffing equation is set to 0.98, and the phase space of the system is as follows image 3 shown. The graphical display of the phase diagram matrix obtained by this method is as follows Figure 4 As shown, the ergodic parameter s=0.0824 of the system in this state is obtained through calculation. Compared with the threshold of chaos discrimination thresh=0.35, it can be seen that the system is not in a chaotic state. The result of the fact is that the system is in a large-scale state at this time. The graphical display of graph matrix confirms this conclusion at the same time, which also shows the effectiveness and correctness of this method.
Embodiment 3
[0068] The difference from Embodiment 1 is that the size of the phase diagram matrix is set to 100×100. The graphical display of the phase diagram matrix obtained by this method is as follows Figure 5 As shown, the ergodic parameter s=0.5462 of the system in this state is obtained through calculation. Compared with the threshold value of thresh=0.35, it can be seen that the system is in a chaotic state. The result of the fact is that the system is in a chaotic state at this time. The graphical display of graph matrix confirms this conclusion at the same time, which also shows the effectiveness and correctness of this method.
PUM
 Abstract
Description
Claims
Application Information
 - R&D
- Intellectual Property
- Life Sciences
- Materials
- Tech Scout
- Unparalleled Data Quality
- Higher Quality Content
- 60% Fewer Hallucinations
Browse by: Latest US Patents, China's latest patents, Technical Efficacy Thesaurus, Application Domain, Technology Topic, Popular Technical Reports.
© 2025 PatSnap. All rights reserved.Legal|Privacy policy|Modern Slavery Act Transparency Statement|Sitemap|About US| Contact US: help@patsnap.com


