Regional power grid electric quantity analyzing and counting system

A power analysis and statistical system technology, applied in information technology support systems, calculations, instruments, etc., can solve problems such as large fluctuations in power sales, affect power grid operation, and inability to perform monthly calculations, achieve fast and efficient statistical analysis, and be conducive to stable development , easy to query and browse the effect

Inactive Publication Date: 2015-04-29
STATE GRID CORP OF CHINA +1
View PDF4 Cites 6 Cited by
  • Summary
  • Abstract
  • Description
  • Claims
  • Application Information

AI Technical Summary

Problems solved by technology

[0002] With the continuous development of the power grid and the continuous increase of electricity consumption data, the proportion of industrial loads is also increasing, and the daily electricity sales fluctuate greatly. At present, it is possible to count the electricity consumption of the whole city and counties It can only be manual statistics of daily electricity sales Excel reports and manually drawn daily electricity curves. The continuous increase in the amount of data and manual statistics can no longer meet the requirements of power grid development, and it is impossible to carry out monthly, annual, year-on-year, and chain-to-month statistics, which makes it impossible to be scientific and reasonable. Arranging the operation mode of the power grid will affect the safe and stable operation of the power grid

Method used


Image

  • Regional power grid electric quantity analyzing and counting system
  • Regional power grid electric quantity analyzing and counting system

Examples


Embodiment Construction

[0016] The present invention will be further described below in conjunction with the accompanying drawings.

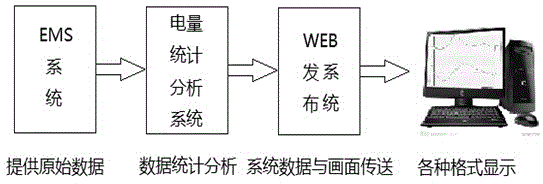
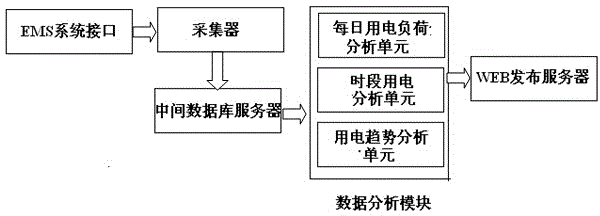
[0017] Such as figure 1 , figure 2 As shown, a kind of regional power grid power analysis and statistics system provided by the present invention includes a collector, an intermediate database server, a data analysis module and a WEB publishing system server. The collector communicates with the EMS system interface data, and extracts the original The electricity consumption data is stored in the intermediate database server, and the data analysis module statistically analyzes the original electricity consumption data in the intermediate database server to generate different curve icons, which are then uploaded through the WEB publishing server and displayed in the form of web pages.

[0018] The collector is equipped with a timer, which regularly extracts the original power consumption data from the EMS system at specified time intervals. The collector is also equip...


PUM


Abstract

The invention discloses a regional power grid electric quantity analyzing and counting system which comprises a collector, an intermediate database server, a data analysis module and a WEB release server. The collector is in data communication with an EMS system interface, original electric data are extracted according to the stipulated time interval and stored in the intermediate database server, the original electric data in the intermediate database server are counted and analyzed through the data analysis module to generate different curve icons, and the icons are uploaded through the WEB release server and displayed in a webpage mode. The data analysis module comprises a daily electricity use load analysis unit, a time period electricity use analysis unit and an electricity use trend analysis unit. All power grid electric quantity data capable of being provided by an EMS system are extracted, after the data are integrated, counted and analyzed, various modes needed by statistical personnel are automatically generated, various defects generated in the electricity quantity data counting conducted manually every day are avoided, data are counted and analyzed rapidly and efficiently, and stable development of a power grid is facilitated.

Description

technical field [0001] The invention relates to the field of electricity consumption management, in particular to an analysis and statistics system for electric quantity of a regional power grid. Background technique [0002] With the continuous development of the power grid and the continuous increase of electricity consumption data, the proportion of industrial loads is also increasing, and the daily electricity sales fluctuate greatly. At present, it is possible to count the electricity consumption of the whole city and counties It can only be manual statistics of daily electricity sales Excel reports and manually drawn daily electricity curves. The continuous increase in the amount of data and manual statistics can no longer meet the requirements of power grid development, and it is impossible to carry out monthly, annual, year-on-year, and chain-to-month statistics, which makes it impossible to be scientific and reasonable. Arranging the operation mode of the power grid...

Claims


Application Information

Patent Timeline
Patent Type & Authority Applications(China)
IPC IPC(8): G06Q50/06
CPCG06Q50/06Y04S10/50
Inventor 张南李芳芳范跃贞刘杰张琳耿晓辉宋曙光卢树成耿星河李红刚罗孝刚周阳
Owner STATE GRID CORP OF CHINA
Why Eureka
Try Eureka