Method and device for dynamically generating three-dimensional chart

A technology for dynamically generating charts, applied in special data processing applications, instruments, electrical digital data processing, etc., can solve problems such as the complexity of the process of generating charts, achieve intuitive and true reflection, simplify cumbersomeness, and increase dynamic effects

Active Publication Date: 2015-05-06
IDEAPOOL CULTURE & TECH CO LTD
View PDF3 Cites 12 Cited by
  • Summary
  • Abstract
  • Description
  • Claims
  • Application Information

AI Technical Summary

Problems solved by technology

[0005] Embodiments of the present invention provide a method and device for dynamically generating three-dimensional ...

Method used


Image

  • Method and device for dynamically generating three-dimensional chart
  • Method and device for dynamically generating three-dimensional chart
  • Method and device for dynamically generating three-dimensional chart

Examples


Embodiment 1

[0054] The first embodiment provides a method for dynamically generating three-dimensional charts. Before generating charts, the dynamic chart generating device can pre-store multiple chart types, graphic primitives corresponding to each chart type, and attribute parameters of the graphic primitives. and the attribute parameters of text primitives.

[0055] The graphics primitives include, but are not limited to: rectangles, cubes, cylinders, pie charts, polylines, and the like.

[0056] The attribute parameters of the graphical primitives are used to dynamically generate the graphical primitives in the chart, and the attribute parameters of the graphical primitives include but are not limited to: size parameters (specifically length parameters, width parameters, height parameters, radius parameters , scale parameters, etc., which can be selected according to the category of graphic primitives), color parameters, position parameters, scaling parameters and other appearance att...

Embodiment 2

[0077] The method for dynamically generating a three-dimensional chart in Embodiment 1 will be described in detail below through specific application scenarios. It should be noted that the present invention includes but not limited to the following examples.

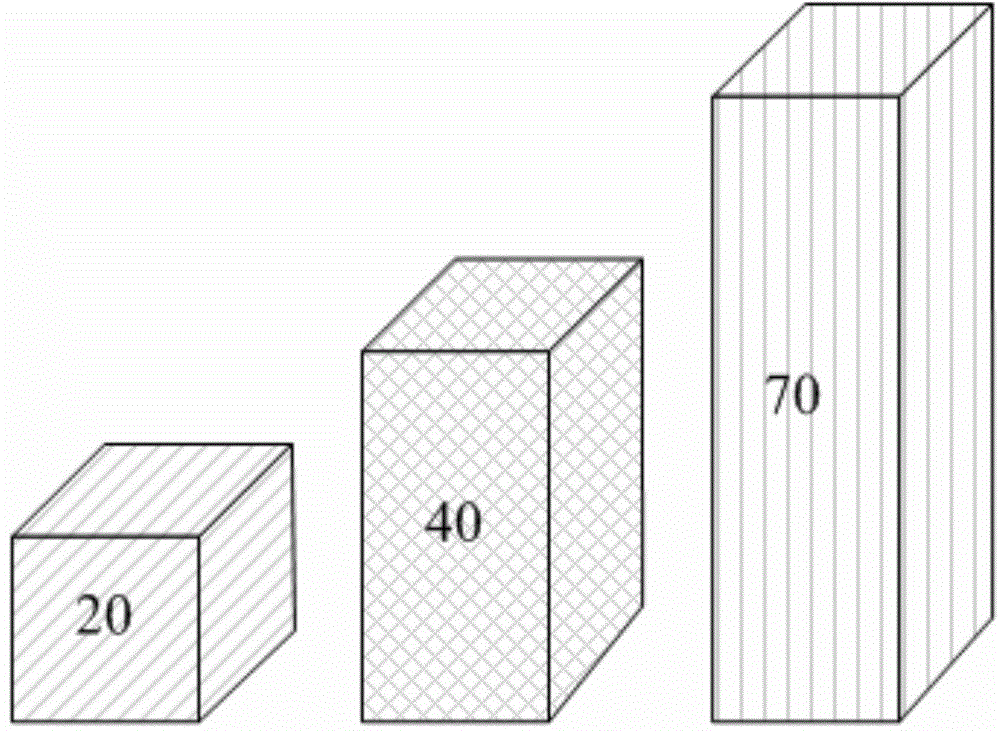
[0078] Scenario 1: Dynamically generate a 3D clustered histogram

[0079] First, before dynamically generating a three-dimensional clustered column chart, it is necessary to add corresponding titles, tick marks, and other descriptive text to the chart.

[0080] Secondly, the user inputs the graph type and graph data to be dynamically generated, the graph type is a three-dimensional clustered column graph, and the graph data is {200; 400; 700}.

[0081] The graph dynamic generation device can determine that the graph primitive corresponding to the received graph type is a cube according to the corresponding relationship between the received graph type and the graphic primitive, the attribute parameter of the graphical pr...

Embodiment 3

[0100] In the third embodiment of the present invention, a dynamic generation device for three-dimensional charts is provided, such as Figure 4 As shown, it is a schematic structural diagram of a device for dynamically generating three-dimensional charts provided by Embodiment 3 of the present invention, which specifically includes the following functional modules:

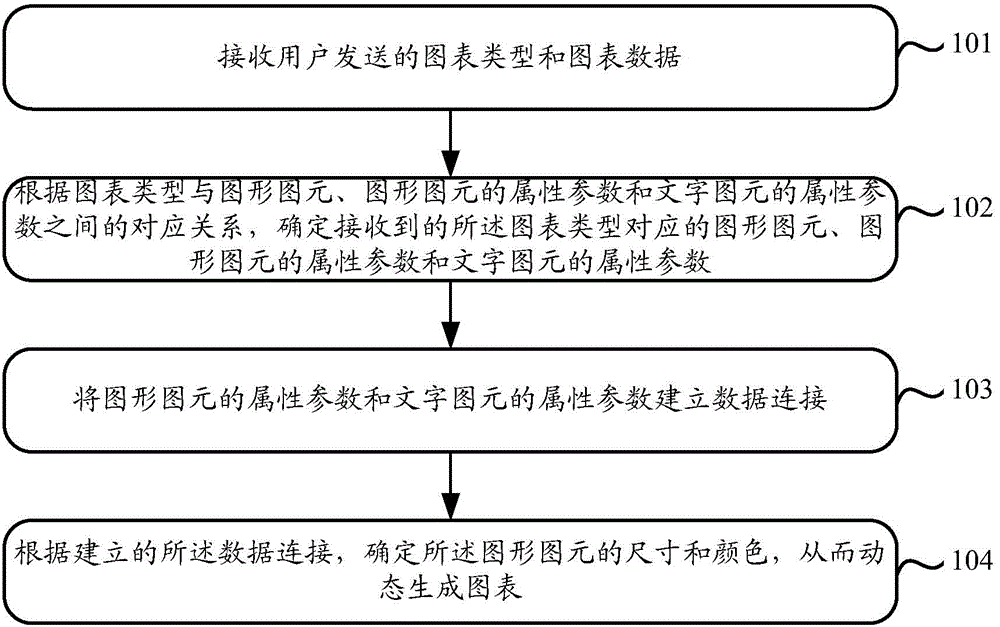
[0101] The receiving module 201 is configured to receive the chart type and chart data sent by the user.

[0102] The determining module 202 is configured to determine the graphic primitives corresponding to the chart type received by the receiving module 201, The attribute parameters of graphics primitives and the attribute parameters of text primitives.

[0103] The establishment module 203 is used to establish data connection between the attribute parameters of the graphics primitive and the attribute parameters of the text primitive.

[0104] Wherein, the attribute parameters of the graphic primitives inclu...


PUM


Abstract

The invention discloses a method and device for dynamically generating a three-dimensional chart. The method for dynamically generating the three-dimensional chart mainly comprises the steps that when the chart type and chart data sent by a user are received, a graph primitive corresponding to the received chart type, the dimension parameter of the graph primitive and the verbal content parameter of a verbal primitive are determined according to the corresponding relation between chart types and graph primitives, the corresponding relation between the chart types and the attribute parameters of graph primitives and the corresponding relation between the chart types and the attribute parameters of verbal primitives, the size and the color of the graph primitive are determined according to data connection established between the attribute parameters of the graph primitives and the attribute parameters of verbal primitives, and then the chart is dynamically generated. In this way, a complicated chart generation process is avoided, and the chart generation processes are simplified.

Description

technical field [0001] The invention relates to the technical field of radio and television graphics and text production, in particular to a method and device for dynamically generating three-dimensional charts. Background technique [0002] In the existing technology, graphs are very intuitive information. Due to their simple and clear information expression, they are often applied in various scenes accessible to the public, such as media TV, work meetings, school classrooms, and statistics subjects. . [0003] There are many types of charts, including rectangles, cubes, cylinders, pie charts, etc. At present, the process of generating charts is relatively complicated, and the process of modifying them is also relatively cumbersome. For example, when generating a pie chart, it is necessary to divide the proportion of data according to the data group A to be reflected, and when identifying data errors or wishing to represent another group of data group B, it is necessary t...

Claims


Application Information

Patent Timeline
IPC IPC(8): G06F17/24G06F17/30
Inventor 李刚李金楠
Owner IDEAPOOL CULTURE & TECH CO LTD
Why Eureka
Try Eureka