Configurable multidimensional dynamic data graph group association method

A dynamic association and multi-dimensional data technology, applied in the field of data processing, can solve problems such as cumbersome configuration, complex functions, and lack of appropriate display of data association, and achieve the effect of clear logic and good scalability

Inactive Publication Date: 2015-11-04
CETHIK GRP
View PDF1 Cites 13 Cited by
  • Summary
  • Abstract
  • Description
  • Claims
  • Application Information

AI Technical Summary

Problems solved by technology

Common multi-dimensional data display tools usually have single functions, although the data can be drilled up and down, but the relationship between the data lacks a proper display; or the functions are complex and the configuration is cumbersome, often requiring manual writing of a large number of codes or scripts

Method used


Image

  • Configurable multidimensional dynamic data graph group association method
  • Configurable multidimensional dynamic data graph group association method
  • Configurable multidimensional dynamic data graph group association method

Examples


Embodiment

[0033] Embodiment: The present invention is used for a comprehensive analysis application of urban population, and the migrant population is analyzed. According to different requirements, multi-dimensional combination analysis can be carried out on the immigrant population. In this embodiment, in order to simplify the description, only the police station of the temporary residence of the migrant population and the place of origin of the place of origin are analyzed, that is, the two dimensions of "region" and "native place distribution". Of course, more dimensions can be added to the analysis.

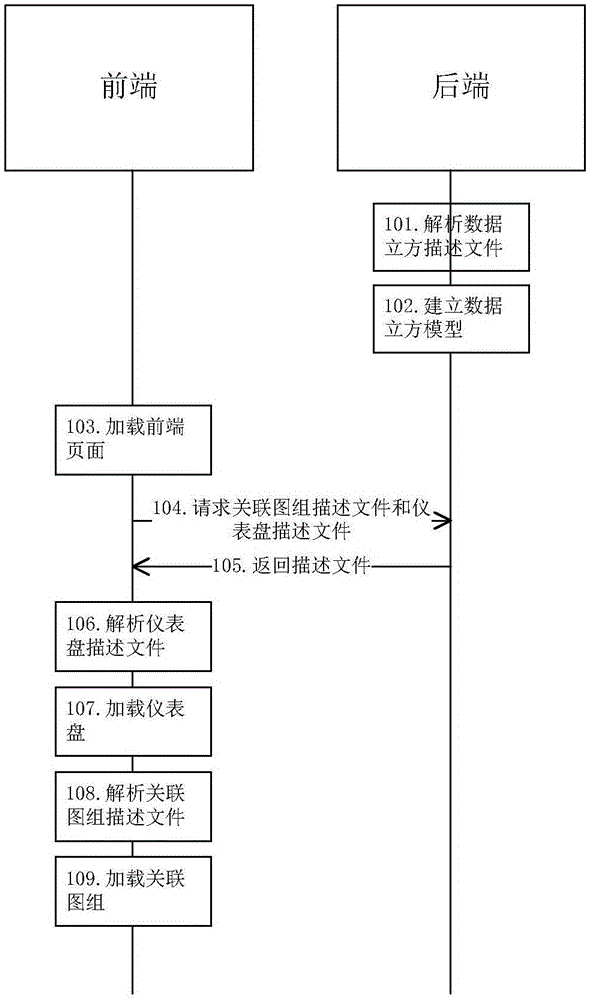
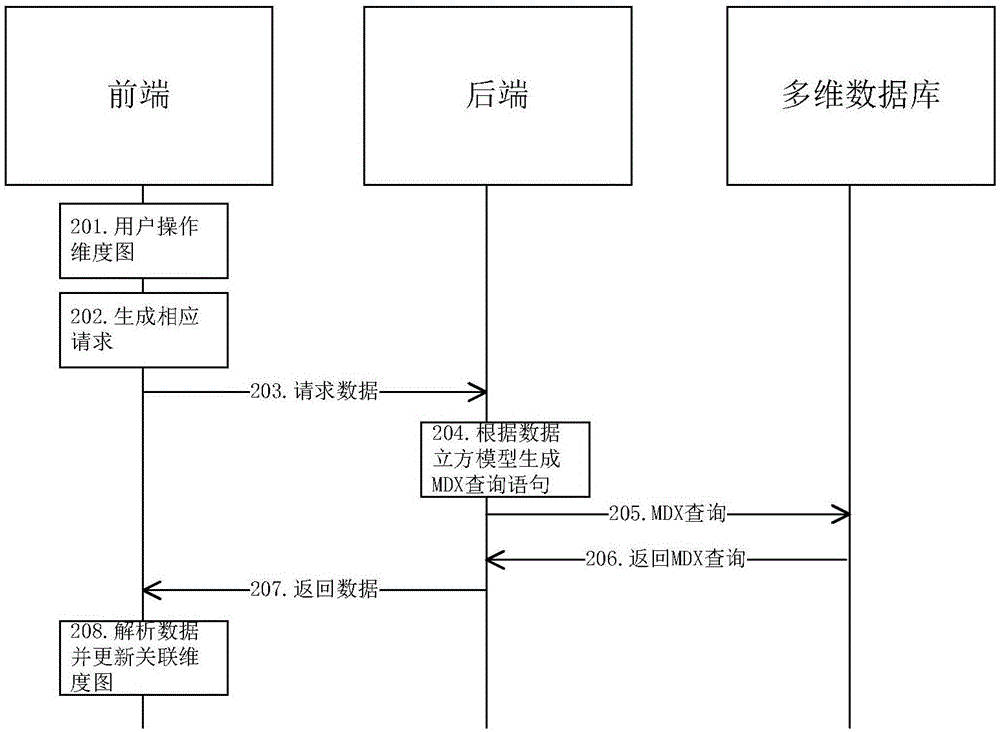
[0034] The system used in the method of the present invention mainly includes a front end and a back end. The back end is mainly responsible for establishing a data model according to the data cube description file, responding to a request from the front end during operation, generating MDX multidimensional data query and returning data results; The description file generates a multi-d...


PUM


Abstract

The invention relates to a configurable multidimensional dynamic data graph group association method. According to the method provided by the invention, a group of associated dimension graphs simultaneously show multiple dimensions of a data cube; by clicking one dimension graph, other associated dimension graphs can vary correspondingly according to the clicked content; each dimension graph may perform up and down data drilling, and meanwhile, other associated dimension graphs can vary according to the content of up and down drilling. A configuration file used in the method comprises a back-end data cube description file, a front-end associated graph group description file and an instrument panel description file; and a back-end data logic, a front-end multidimensional associated graph group and an instrument panel page layout are decoupled. The method described in the invention may be applied in an OLAP system and a commercial intelligent system.

Description

technical field [0001] The invention relates to the technical field of data processing, in particular to a configurable multi-dimensional dynamic associated data graph group method. Background technique [0002] In OLAP systems and business intelligence systems, it is often necessary to use charts to display multidimensional data models and to display the relationship between multidimensional data. Through analysis actions such as drilling up and down, slicing, and rotating, in order to analyze data, users can learn from multiple Observing the data in the database from different angles and from multiple sides, so as to deeply understand the information contained in the data. Common multi-dimensional data display tools usually have single functions. Although the data can be drilled up and down, the relationship between the data lacks a proper display; Contents of the invention [0003] In order to overcome the above disadvantages, the present invention aims to provide a co...

Claims


Application Information

Patent Timeline
IPC IPC(8): G06F17/30
CPCG06F16/248G06F16/283
Inventor 陈琼赵明李正浩
Owner CETHIK GRP
Why Eureka
Try Eureka