Method for predicting PM2.5 concentration of regional air
What is AI technical title?
AI technical title is built by Patsnap AI team. It summarizes the technical point description of the patent document.
A concentration prediction and area technology, applied in prediction, special data processing applications, instruments, etc., can solve the problems of insufficient training sample data, low prediction accuracy, and low model prediction accuracy.
Inactive Publication Date: 2015-12-23
NINGBO UNIV +1
View PDF4 Cites 13 Cited by
Summary
Abstract
Description
Claims
Application Information
AI Technical Summary
This helps you quickly interpret patents by identifying the three key elements:
Problems solved by technology
Method used
Benefits of technology
Problems solved by technology
Whether it is an SVR model or an artificial neural network model, the time series characteristics of variables need to be considered in the prediction of pollutant concentration, and the time lag factor must be considered in the input parameters of the model, so that the input parameters of the model have high dimensions and the training sample data is insufficient. The prediction accuracy of the model is not high
To this end, some scholars proposed a genetic-neural network (GA-ANN) model, GA-ANN uses the neural network (ANN) model to predict and model the concentration of atmospheric pollutants, and uses the genetic algorithm (GA) to predict the The index selects 0 or 1 for the input parameters, which reduces the dimension of the input parameters and avoids the overfitting of the model to a certain extent, but at the same time loses useful information of some input parameters, and the prediction accuracy is still not high
Method used
Image
Click on the blue label to locate the original text in one second.
Reading with bidirectional positioning of images and text.
Examples
Embodiment 1
[0035] Embodiment one: a kind of regional air PM2.5 concentration prediction method, comprises the following steps:
[0036] ① Construct the training sample data of the support vector machine regression model to be trained:
[0037] ①-1 records the current moment as t moment, t-n moment represents the first n moments of the current moment, n=1,2,3,4,...;
[0038] Denote the atmospheric visibility of the regional air measured at time t-1 as x N (t-1), the turbidity is recorded as x Z (t-1), the temperature is recorded as x T (t-1), the air pressure is recorded as x p (t-1), the wind speed is recorded as x w (t-1);
[0039] will t-t d The concentration of SO2 in the regional air measured at all times is denoted as x so2 (t-t d ), the concentration of NO2 is recorded as x No2 (t-t d ), the concentration of PM10 is recorded as x pm10 (t-t d ), the concentration of PM2.5 is recorded as x pm25 (t-t d ), the concentration of O3 is recorded as x o3 (t-t d ), the concen...
Embodiment 2
[0056] Embodiment two: a kind of area air PM2.5 concentration prediction method, comprises the following steps:
[0057] ① Construct the training sample data of the support vector machine regression model to be trained:
[0058] ①-1 records the current moment as t moment, t-n moment represents the first n moments of the current moment, n=1,2,3,4,...;
[0059] Denote the atmospheric visibility of the regional air measured at time t-1 as x N (t-1), the turbidity is recorded as x Z (t-1), the temperature is recorded as x T (t-1), the air pressure is recorded as x p (t-1), the wind speed is recorded as x w (t-1);
[0060] will t-t d The concentration of SO2 in the regional air measured at all times is denoted as x so2 (t-t d ), the concentration of NO2 is recorded as x No2 (t-t d ), the concentration of PM10 is recorded as x pm10 (t-t d ), the concentration of PM2.5 is recorded as x pm25 (t-t d ), the concentration of O3 is recorded as x o3 (t-t d ), the concentrat...
PUM
Abstract
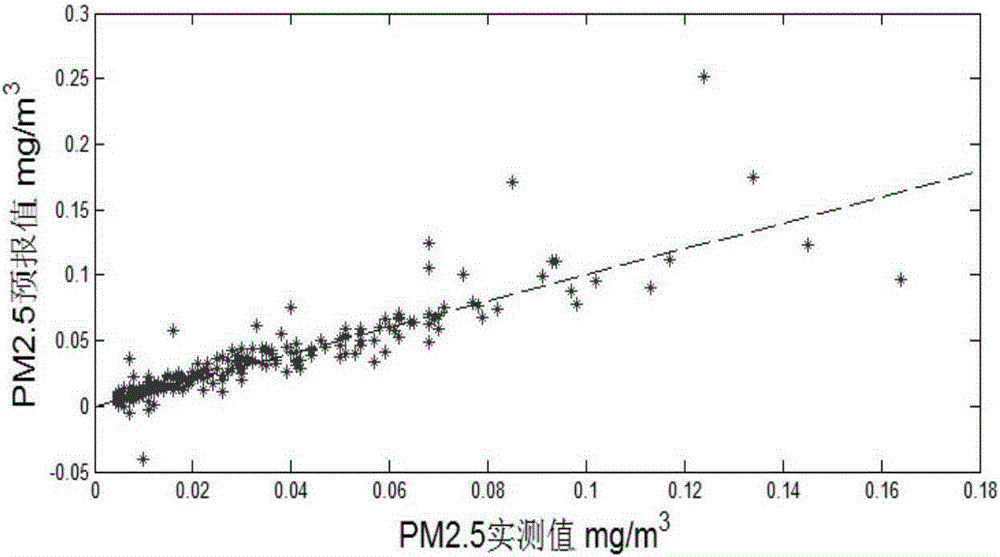
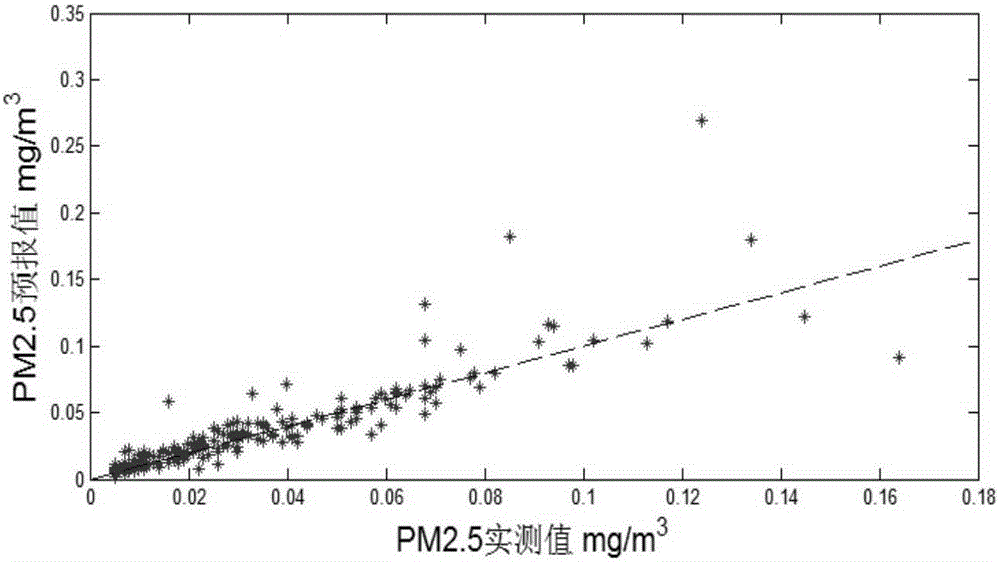
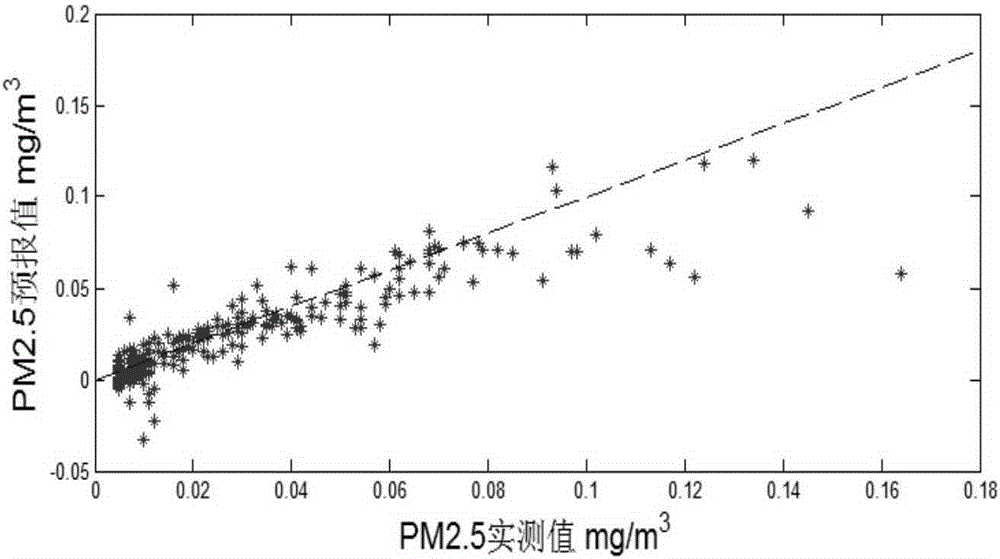
The invention discloses a method for predicting the PM2.5 concentration of regional air. The method comprises the steps that firstly, training sample data of a support vector machine regression model to be trained are constructed through historical data, then the trained support vector machine regression model is obtained through the training sample data, and the trained support vector machine regression model is treated as a PM2.5 concentration prediction model; then a particle swarm optimizationalgorithm is combined with the PM2.5 concentration prediction model, through the continuous optimization and iteration of the particle swarm optimizationalgorithm, input parameters of the PM2.5 concentration prediction model are reconstructed continuously through the particle positions till the final global polarity of a particle swarm is obtained after iteration is completed, an input parameter of the PM2.5 concentration prediction model is reconstructed with the position of the particle corresponding to the final global extreme value of the particle swarm, and when the input parameter is input into the PM2.5 concentration prediction model, the obtained output is considered as the PM2.5 concentration. The method has the advantages that the dimensionality of the input parameters of the PM2.5 concentration prediction model can be lowered, and the PM2.5 concentration prediction accuracy can be improved.
Description
technical field [0001] The invention relates to a PM2.5 concentration prediction method, in particular to a regional air PM2.5 concentration prediction method. Background technique [0002] With the rapid advancement of industrialization, the phenomenon of atmospheric smog is becoming more and more serious. PM2.5 is one of the main culprits causing smog. Its particle size is small, can be suspended in the air for a long time and spread, and can carry toxic Harmful substances enter the respiratory tract and lungs, posing a direct threat to human health. For this reason, it is of great significance to predict the concentration of PM2.5 based on the historical monitoring data of the atmosphere. However, there are many factors affecting the concentration of PM2.5, such as: instant industrial emissions, the concentration of pollutant particles in the atmosphere, meteorological conditions, seasons and sunlightradiation, and it is challenging to predict its concentration. [000...
Claims
Application Information
Patent Timeline
Application Date:The date an application was filed.
Publication Date:The date a patent or application was officially published.
First Publication Date:The earliest publication date of a patent with the same application number.
Issue Date:Publication date of the patent grant document.
PCT Entry Date:The Entry date of PCT National Phase.
Estimated Expiry Date:The statutory expiry date of a patent right according to the Patent Law, and it is the longest term of protection that the patent right can achieve without the termination of the patent right due to other reasons(Term extension factor has been taken into account ).
Invalid Date:Actual expiry date is based on effective date or publication date of legal transaction data of invalid patent.

