
A Determination Method of Equipment Performance Degradation Radar Chart

A technology for equipment performance and determination methods, which is applied in the direction of measuring devices, instruments, mechanical bearing tests, etc., can solve the problems of difficult to reflect the early performance degradation information of equipment, so as to facilitate users to move down and visualize decision-making, improve recognition ability, improve The effect of sensitivity

Inactive Publication Date: 2018-03-23
HENAN POLYTECHNIC UNIV
View PDF6 Cites 0 Cited by
  • Summary
  • Abstract
  • Description
  • Claims
  • Application Information

AI Technical Summary

Problems solved by technology

Because the traditional performance degradation radar chart is a linear change of parameters, it is difficult to reflect the early performance degradation information of the equipment

Method used


Image

  • A Determination Method of Equipment Performance Degradation Radar Chart
  • A Determination Method of Equipment Performance Degradation Radar Chart
  • A Determination Method of Equipment Performance Degradation Radar Chart

Examples


Embodiment Construction

[0027] The embodiments of the present invention are described in detail below. This embodiment is implemented on the premise of the technical solution of the present invention, and detailed implementation methods and specific operating procedures are provided, but the protection scope of the present invention is not limited to the following implementation example.

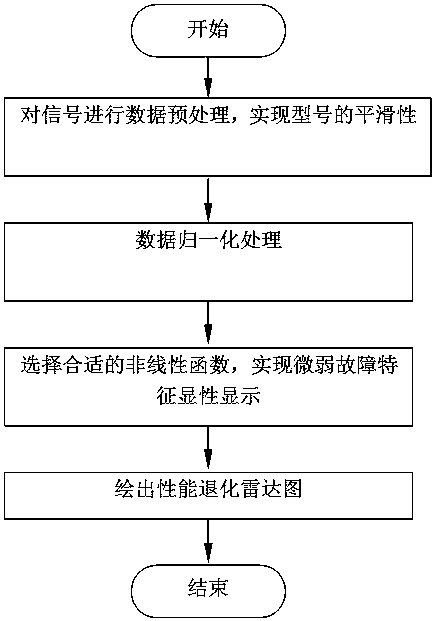
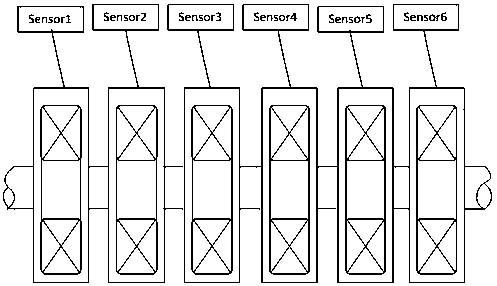
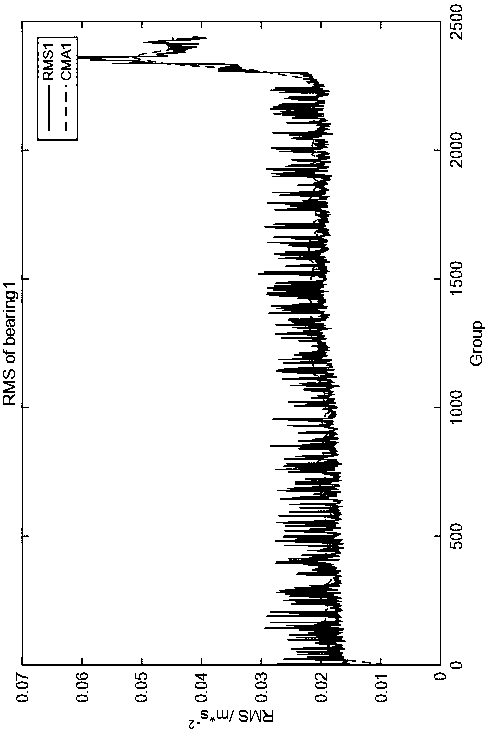
[0028] Such as figure 1 , 2 , Shown in 3 and 5, a kind of equipment performance degradation radar map determination method of the present invention, take the performance degradation radar map of rolling bearing as example below, its specific steps are as follows:

[0029] Install six rolling bearings of model GB6307 on the ABLT-1A bearing testing machine and do the accelerated life test at the same time. The test bench is composed of test head, test head base, transmission system, loading system, lubrication system, computer control system, data acquisition and analysis system. In this experiment, six rolling be...


PUM


Abstract

The invention provides a determination method for an equipment performance degradation radar map. The method comprises the following steps: (1), pre-processing the data of to-be-measured parameters; (2) conducting the normalization treatment on the pre-processed performance parameters in different conditions; (3) selecting an appropriate non-linear function to conduct the explicitation treatment on the performance parameters in different conditions; (4) marking different parameter data on the corresponding coordinate axes of a radar map respectively and connecting all points by line segments so as to obtain a performance degradation radar map of equipment. According to the technical scheme of the invention, the non-linear mathematical treatment is adopted as the core idea of the method, so that the dominance of slowly changing parameters is increased. According to the technical scheme of the invention, slowly changing parameters are subjected to mathematical treatment based on the non-linear function. In this way, the linear treatment method of a conventional performance radar map on all parameters is overcome. In combination with the radar map, the recognition capability of the method for weak fault characteristics is improved. Therefore, the user shift-down and visual decisions of a fault expert decision system is facilitated.

Description

technical field [0001] The invention belongs to the technical field of signal processing and decision visualization, and in particular relates to a method for determining a radar map of equipment performance degradation. Background technique [0002] With the global upgrading of manufacturing industry and the introduction of strategies such as "Internet +", equipment health evaluation, maintenance and trend forecasting based on condition detection are rapidly penetrating into aviation, aerospace, transportation, industrial and agricultural production and even our daily life. middle. Future devices will be more intelligent and humanized, paying more attention to user experience. The user objects of the equipment status monitoring expert system will gradually move down from high-level users to general users (including general technicians and even consumers or operators). Therefore, how to make the condition monitoring information of machinery and equipment transmitted to use...

Claims


Application Information

Patent Timeline
Patent Type & Authority Patents(China)
IPC IPC(8): G01M99/00G01M13/04
CPCG01M13/045G01M99/00
Inventor 王志阳王现辉陈会涛张业明闫亮范俊锴周红梅冷军发李新华
Owner HENAN POLYTECHNIC UNIV
Learn More