
Excel-based method for drawing oblique rose diagram of geologic body and geologic elements

A rose map, geological body technology, applied in the field of geological field measurement data processing, can solve problems such as not knowing programming, not being able to meet the needs of drawing well, and not being able to adapt to geological data processing, etc.

Inactive Publication Date: 2016-09-21
CHINA UNIV OF PETROLEUM (EAST CHINA)
View PDF3 Cites 9 Cited by
  • Summary
  • Abstract
  • Description
  • Claims
  • Application Information

AI Technical Summary

Problems solved by technology

First of all, the rose diagram drawn by Grapher software can only perform simple statistical grouping work on the occurrence data intervals, while the rose diagram actually used in our geology is drawn by connecting the average value of each statistical interval data; in addition , the tendency and dip angle in the inclined rose diagram are represented in different ways. Generally, the length of the radius is used to represent the average dip angle. Grapher software cannot unify the two
Therefore, it still does not meet the drawing needs very well
[0005] To solve the above problems, it is of course best for technicians to use targeted programming, but in fact, most of the technicians in this field do not understand programming, and professional programmers do not have a deep understanding of the principle and application of the inclined rose diagram. Often cannot accurately understand the assumptions and needs of technicians in programming
In short, the current method of drawing oblique rose diagrams has major deficiencies and cannot meet the needs of geological data processing

Method used


Image

  • Excel-based method for drawing oblique rose diagram of geologic body and geologic elements
  • Excel-based method for drawing oblique rose diagram of geologic body and geologic elements

Examples


Embodiment Construction

[0045] The present invention will be further described below in conjunction with the accompanying drawings and embodiments.

[0046] 1. Create a new worksheet

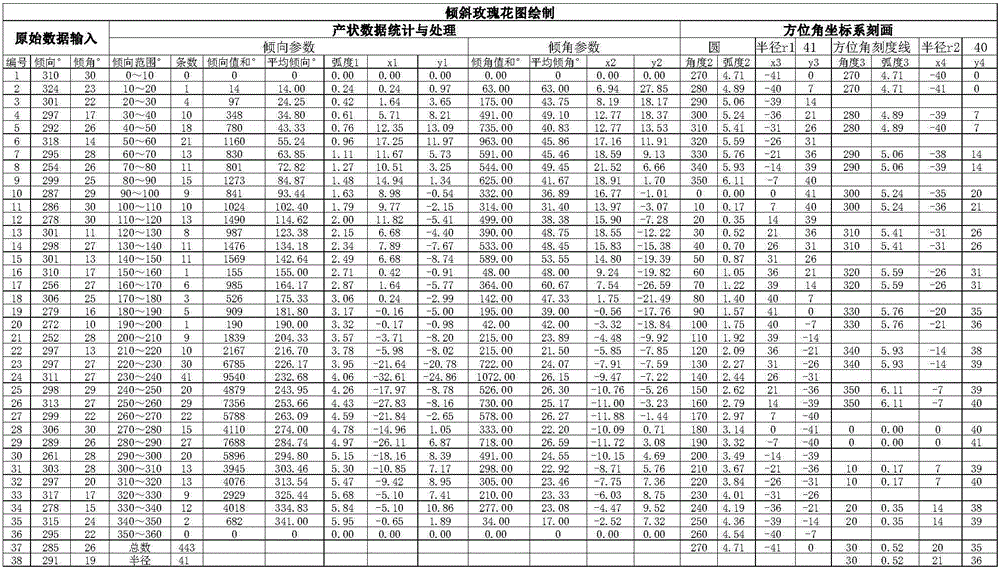
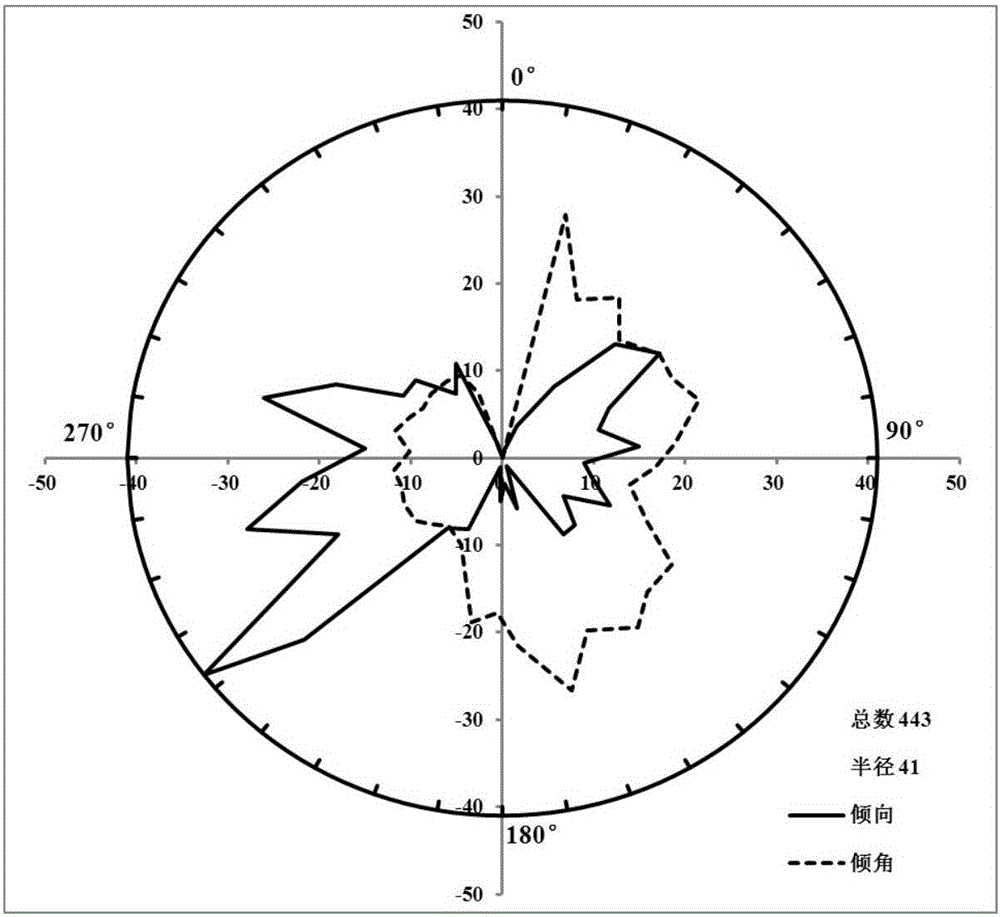
[0047] In the new workbook, create a worksheet with the worksheet label named "Slanted Rosette Drawing". The worksheet mainly includes three parts: original data input, occurrence data statistics and processing, and azimuth coordinate system description. For details, see figure 1 (Only part of it is intercepted).

[0048] 2. Input content in each cell

[0049] First, set the corresponding table header content such as "inclination °", "inclination angle", etc., and the corresponding information input area. For details, see figure 1 .

[0050] A1-V1 is merged and centered, and the title "Drawing a Tilted Rose" is entered;

[0051] A2-C2, A3-C3 are merged and centered, input "original data input", A4 input "number", B4 input "inclination °", C4 input "inclination angle", this is the header of the original data input ...


PUM


Abstract

The invention relates to an Excel-based method for drawing an oblique rose diagram of a geologic body and geologic elements. An Excel template file for drawing the oblique rose diagram is created by using Microsoft Excel2010 software. According to the technical scheme, the method comprises the steps of 1, making an Excel form: inputting original data of measured inclination of the geologic body into the form; processing the original data, performing grouping statistics on an inclination direction and an inclination angle, and converting the inclination direction and the inclination angle into azimuth angle coordinates; and describing an azimuth angle coordinate system and calculating circle coordinates and azimuth angle scale line coordinates; and 2, drawing the oblique rose diagram: drawing the oblique rose diagram in the form of a scatter diagram by the circle coordinates, the azimuth angle scale line coordinates and the coordinates of the inclination direction and the inclination angle, obtained by processing. The method has the advantages that data statistics and processing can be automatically carried out and the diagram can be formed only by inputting the original data; and the method is simple, easy to operate, flexible, high in adaptability, large in data volume, high in accuracy and attractive in maps or drawings, so that the drawing time of the oblique rose diagram is greatly shortened and the working efficiency is improved.

Description

technical field [0001] The invention relates to the field of geology field measurement data processing, in particular to a method for drawing inclined rose diagrams of geological bodies and geological elements based on Excel. Background technique [0002] The oblique rose diagram can qualitatively and visually reflect the inclination of a certain geological body and the dominant distribution of the inclination angle, and is widely used in geology. In sedimentology, the occurrence of cross bedding is drawn as an oblique rose diagram to analyze paleocurrent and paleowind directions, etc. In tectonics, the occurrence of joints is drawn as an oblique rose diagram to indicate the direction and characteristics of joint development in a region , for structural stress analysis. At present, there are two main ways to draw a slanted rose diagram: [0003] One is manual drawing, and there are obvious defects in this drawing method. First of all, it takes a lot of time to carry out d...

Claims


Application Information

Patent Timeline
IPC IPC(8): G06F17/24G06T11/20
CPCG06T11/206G06F40/174
Inventor 罗可钟建华倪良田孙宁亮刘闯李莹
Owner CHINA UNIV OF PETROLEUM (EAST CHINA)
Learn More