Power grid comprehensive information monitoring graph generation system and method

A technology for comprehensive information and graphics generation, applied in graphics and image conversion, image data processing, instruments, etc., can solve the problems of difficult configuration and modification and low reusability in the later stage, so as to improve the utilization rate and reusability of components , Promote efficiency, realize the effect of packaging and flexible configuration

Inactive Publication Date: 2016-09-28
DALIAN POWER SUPPLY COMPANY STATE GRID LIAONING ELECTRIC POWER +3
View PDF2 Cites 6 Cited by
  • Summary
  • Abstract
  • Description
  • Claims
  • Application Information

AI Technical Summary

Problems solved by technology

[0005] Aiming at the defects of relatively low reusability of the large-screen graphic design scheme of the existing power grid monitoring system and difficulty in later configuration and modification, the present invention proposes the following technical solutions:

Method used


Image

  • Power grid comprehensive information monitoring graph generation system and method
  • Power grid comprehensive information monitoring graph generation system and method
  • Power grid comprehensive information monitoring graph generation system and method

Examples


Embodiment approach

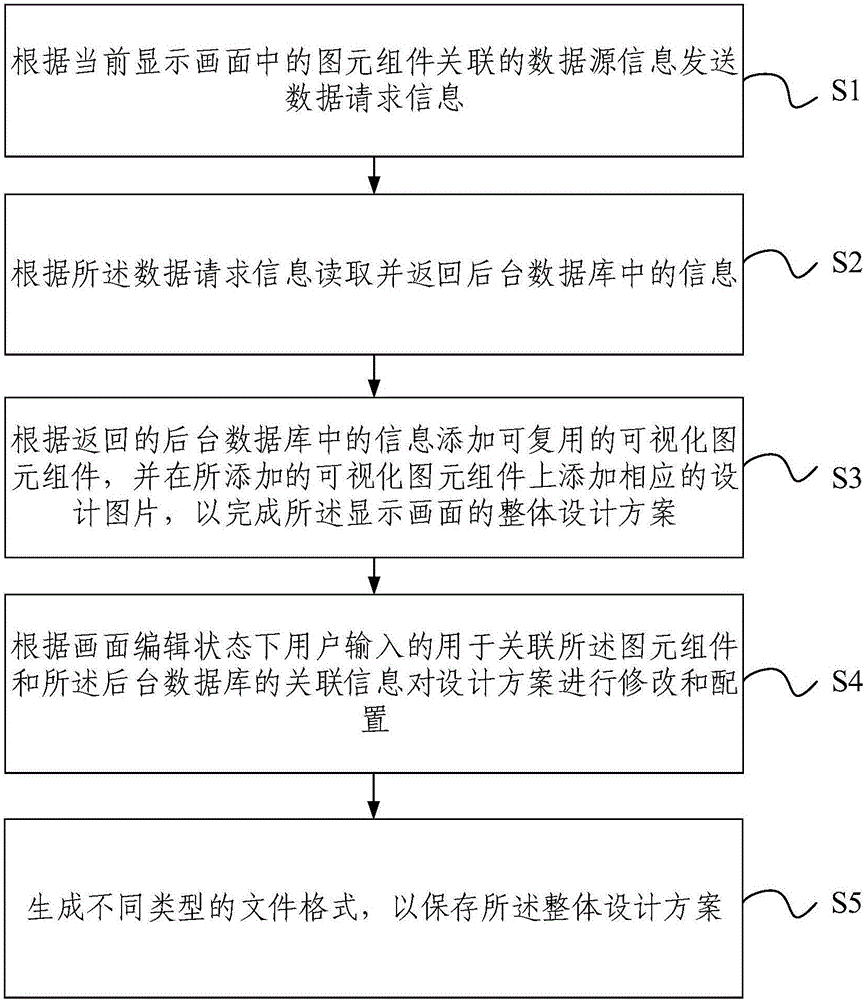
[0073] As another preferred implementation of the method in this embodiment, the method may also include:

[0074] Rendering and real-time displaying is performed on the current display screen in the browsing state.

[0075] Further, as a preference of this embodiment, the above method may also include:

[0076] The overall design scheme of the display screen is stored.

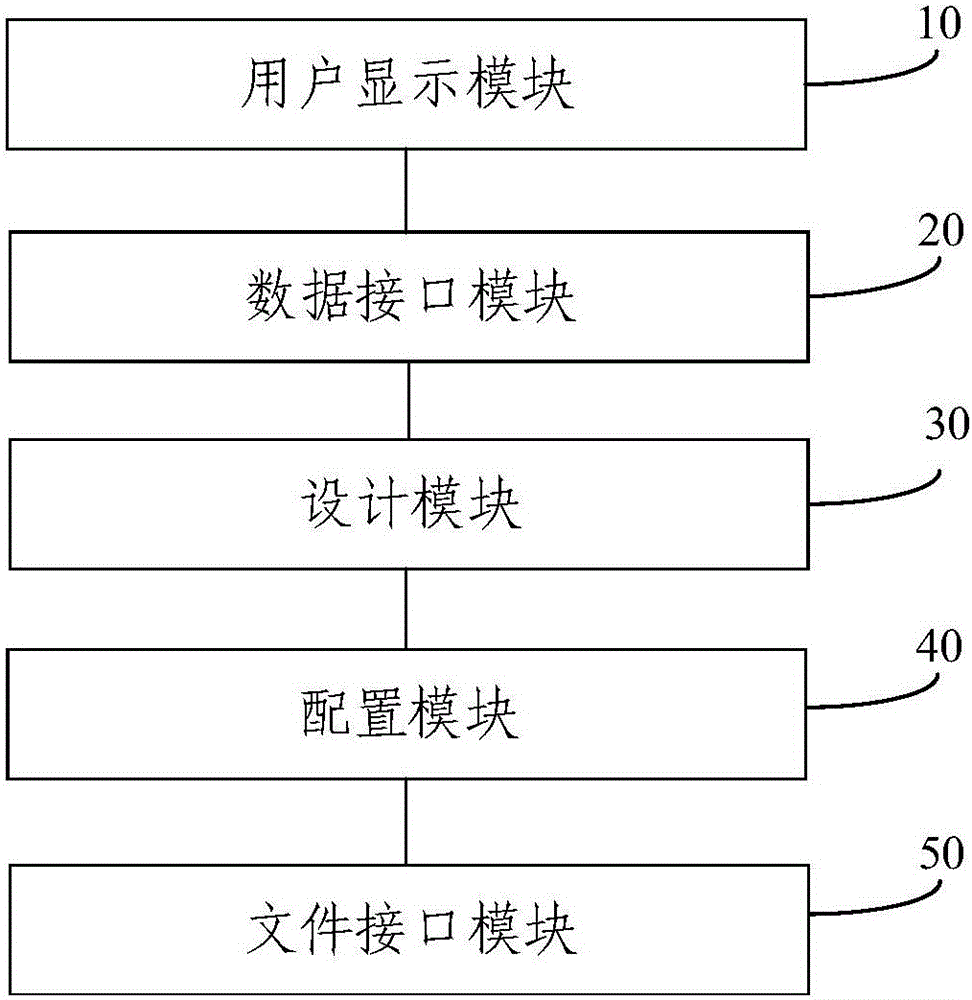
[0077] Specifically, the system can call the class of the relevant graphic component according to the information stored in the screen, read the associated data source information, and draw and display it on the large screen.

[0078] Wherein, the type of the graphic component includes any one or a combination of the following:

[0079] Column charts, pie charts, gauges, curves, and radar charts.

[0080] It can be understood that the graphic element component adopts a modular design to facilitate the design and development of new graphic elements.


PUM


Abstract

The invention relates to a power grid comprehensive information monitoring graph generation system and method, and the system comprises a user display module, a data interface module, a design module, a configuration module, and a file interface module. According to the invention, the system and method build a mapping relation library based on a large-screen overall design scheme and a graphic file, which are generated in an integrated manner, and a visual graph element assembly. The system and method can achieve the packaging and flexible configuration of the visual assembly, can iron out the defects that a large-screen graph design scheme of a conventional power grid monitoring system is lower in reusability and is difficult for later configuration and modification, can improve the utilization rate and the reusability of the assembly, and can improve the implementation efficiency of a project.

Description

technical field [0001] The invention relates to the field of power grid scheduling automation, in particular to a system and method for generating grid comprehensive information monitoring graphs. Background technique [0002] With the development of the power industry and the continuous expansion of the grid scale, the amount of information is increasing, and the analysis and calculation of the power system are becoming more and more complex. It is urgent to establish a complete and accurate large-screen monitoring system to realize the information monitoring of the grid. [0003] In the existing power grid monitoring system, the design and generation of large-screen graphics are integrated. The design and generation of large-screen solutions requires the participation of R&D personnel from the beginning to the end, and the reusability of the designed solutions is relatively low. In the later stage of the implementation of the scheme, for engineers, since they are not the R...

Claims


Application Information

Patent Timeline
Patent Type & Authority Applications(China)
IPC IPC(8): G06T3/40G06Q50/06
CPCG06Q50/06G06T3/4038
Inventor 孙丽卿杨万清马强程大闯梅迪苗伟威刘艳刘冰吕霏赵春光张葆刚刘铭超栾敬钊王银照
Owner DALIAN POWER SUPPLY COMPANY STATE GRID LIAONING ELECTRIC POWER
Why Eureka
Try Eureka