Supercharge Your Innovation With Domain-Expert AI Agents!

Visualization method, device and system for dependence relation of global task nodes

A technology of task nodes and dependencies, applied in the computer field, can solve the problems of one-sided display, cumbersome user operation, and insufficient comprehensiveness, and achieve the effect of saving operation steps.

Active Publication Date: 2017-01-04
ALIBABA GRP HLDG LTD
View PDF5 Cites 15 Cited by
  • Summary
  • Abstract
  • Description
  • Claims
  • Application Information

AI Technical Summary

Problems solved by technology

However, the above process can only display the next-level task nodes of the current task node, and the display is one-sided; and, for a task node A, the user needs to click multiple times step by step to obtain the downstream dependent task nodes of the task node. , so as to obtain the downstream dependencies. For example, the task nodes of the next level of task node A include A1, A2, and A3. The user needs to click A1, A2, and A3 to obtain the respective next-level task nodes of A1, A2, and A3, thereby obtaining Part of the downstream dependencies of task node A. Therefore, the above process is cumbersome for users to operate, and the obtained dependencies are only downstream dependencies, which is not comprehensive enough.

Method used


Image

  • Visualization method, device and system for dependence relation of global task nodes
  • Visualization method, device and system for dependence relation of global task nodes
  • Visualization method, device and system for dependence relation of global task nodes

Examples


Embodiment 1

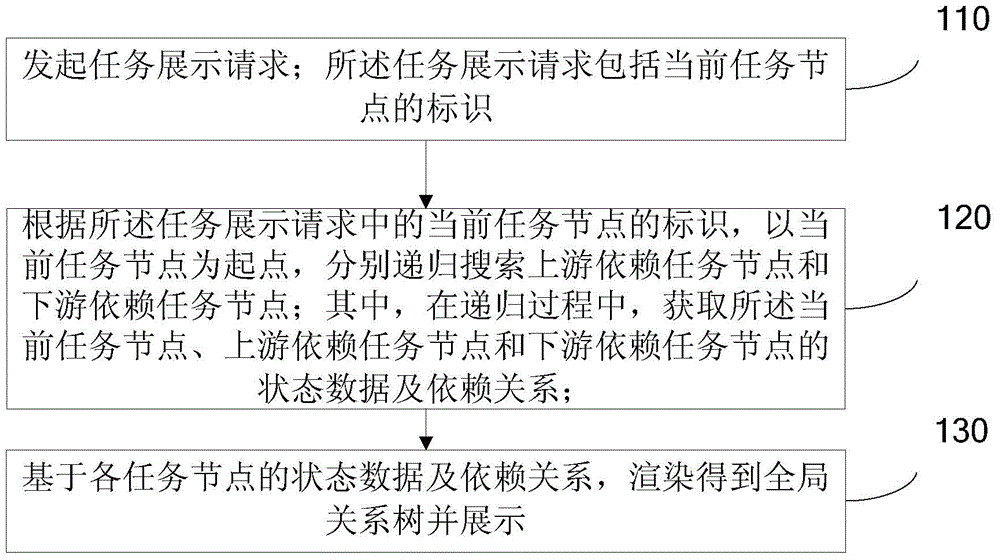
[0028] refer to figure 1 , which shows a flow chart of steps of an embodiment of a method for visualizing global task node dependencies of the present application, which may specifically include the following steps:

[0029] Step 110, initiate a task presentation request; the task presentation request includes the identification of the current task node;

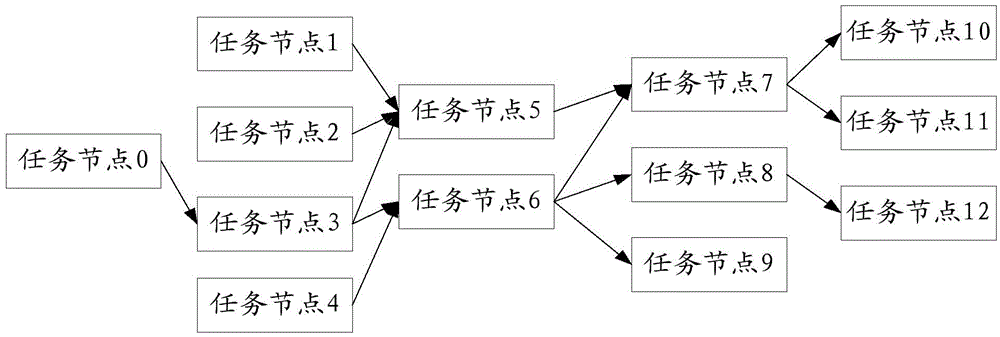
[0030] In the embodiment of this application, taking the ODPS platform as an example, when deploying a certain data service, the data service will be split into a series of tasks and deployed on the ODPS platform. The above tasks are the minimum scheduling tasks running on the data platform unit of work. However, since there is a dependency relationship between each task in the series of tasks, each task can be regarded as a task node, and each task node may have a dependency relationship with one or more task nodes. Such as Figure 1A As shown in the example, the results processed by task nodes 1, 2, and 3 are transmitte...

Embodiment 2

[0109] refer to figure 2 , which shows a flow chart of steps of an embodiment of a method for visualizing global task node dependencies of the present application, which may specifically include the following steps:

[0110] Step 210, initiate a task display request; the task display request includes the identifier of the current task node, and the upstream dependency level and downstream dependency level starting from the current task node;

[0111] In the embodiment of the present invention, the user can set the upstream dependency level and downstream dependency level to be displayed on the client side, specify the ID of the current task node, and then send it to the background server through the task display request. The upstream dependency level and the downstream dependency level are both levels relative to the current task node. for example Figure 1A Task node 6 in , task nodes 3 and 4 directly associated with task node 6 are the first-level upstream dependencies re...

Embodiment 3

[0123] refer to image 3 , which shows a structural block diagram of an embodiment of a global task node relationship visualization device of the present application, which may specifically include the following modules:

[0124] A display request initiating module 310, configured to initiate a task display request; the task display request includes the identifier of the current task node;

[0125] The recursive search module 320 is configured to recursively search for upstream dependent task nodes and downstream dependent task nodes respectively based on the identifier of the current task node in the task display request, starting from the current task node; wherein, in the recursive process, obtain all State data and dependencies of the current task node, upstream dependent task nodes and downstream dependent task nodes;

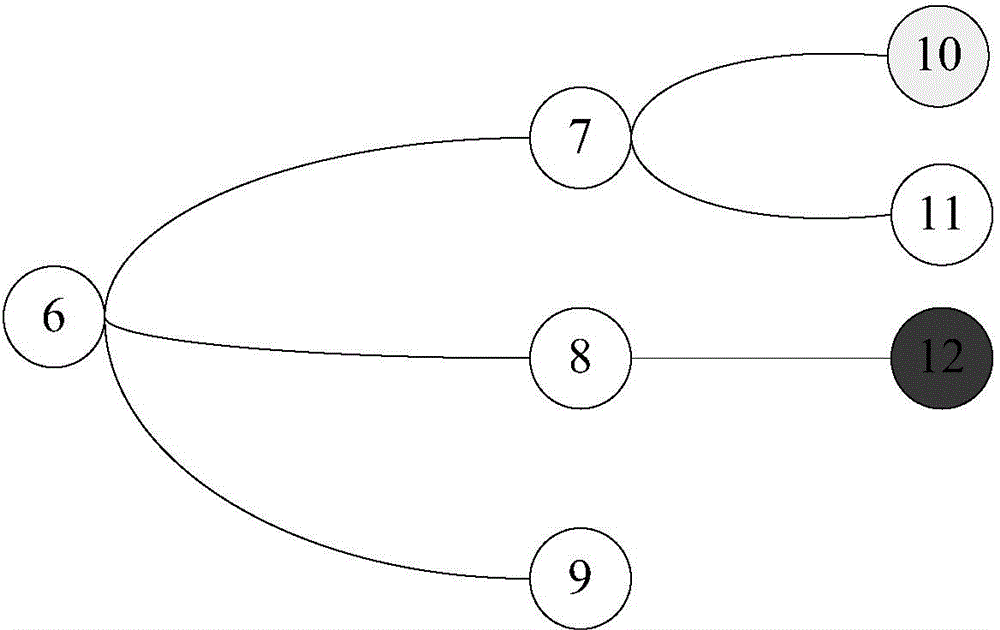
[0126] The rendering and displaying module 330 is configured to render and display the global relationship tree based on the status data and dependencies...


PUM


Abstract

The embodiment of the application provides a visualization method, device and system for the dependence relation of global task nodes and relates to the technical field of computers. The visualization method comprises the following steps: initiating a task displaying request, wherein the task displaying request comprises an identifier of a current task node; adopting the current task node as a starting point to search upstream dependent task nodes and downstream dependent task nodes respectively and recursively according to the identifier of the current task node in the task displaying request; in the recursive process, acquiring state data and the dependence relation of the current task node, the upstream dependent task nodes and the downstream dependent task nodes; on the basis of the state data and the dependence relation of all the task nodes, rendering to obtain and display a global relation tree. The visualization method, device and system disclosed by the embodiment of the application have the advantages that the operation steps of users are saved; due to the comprehensive dependence relation of the current stage, the dependence relation of the upstream and the downstream of the current task node can be simultaneously displayed, so that the users can conveniently manage deployed tasks in a unified manner.

Description

technical field [0001] The present application relates to the field of computer technology, and in particular to a method for visualizing dependencies of global task nodes, a device for visualizing dependencies of global task nodes, and a system for visualizing dependencies of global task nodes. Background technique [0002] With the application of big data, many data processing platforms will process various data, such as ODPS platform (Open Data Processing Service, open data processing service), the data platform provides TB / PB level data, real-time requirements are not high The distributed processing capability can be applied to data analysis, mining, business intelligence and other fields. [0003] Then, during the data development process, for a certain data business, the developer will disassemble it into a series of tasks and deploy them to the data platform. The task is the smallest scheduling unit running on the data platform. Among them, there may be a certain dep...

Claims


Application Information

Patent Timeline
IPC IPC(8): G06F9/50
CPCG06F9/50
Inventor 吉悦
Owner ALIBABA GRP HLDG LTD
Features
  • R&D
  • Intellectual Property
  • Life Sciences
  • Materials
  • Tech Scout
  • Unparalleled Data Quality
  • Higher Quality Content
  • 60% Fewer Hallucinations
Learn More