Visual analysis method and system

An analysis method and analysis engine technology, applied in the field of big data visual analysis, can solve the problems of inability to efficiently analyze data, slow data analysis speed, lack of human-machine interactive visual analysis methods, etc., to improve data analysis efficiency, Realize the effect of man-machine exchange

Inactive Publication Date: 2017-01-25
冯一村
View PDF4 Cites 31 Cited by
  • Summary
  • Abstract
  • Description
  • Claims
  • Application Information

AI Technical Summary

Problems solved by technology

[0007] In view of this, the purpose of the present invention is to provide a visual analysis method and system to solve the problem of slow data analysis speed in the prior art, the inabili

Method used


Image

  • Visual analysis method and system
  • Visual analysis method and system
  • Visual analysis method and system

Examples


Example Embodiment

[0053] Example one

[0054] To facilitate the understanding of this embodiment, a visual analysis method disclosed in the embodiment of the present invention is first introduced in detail.

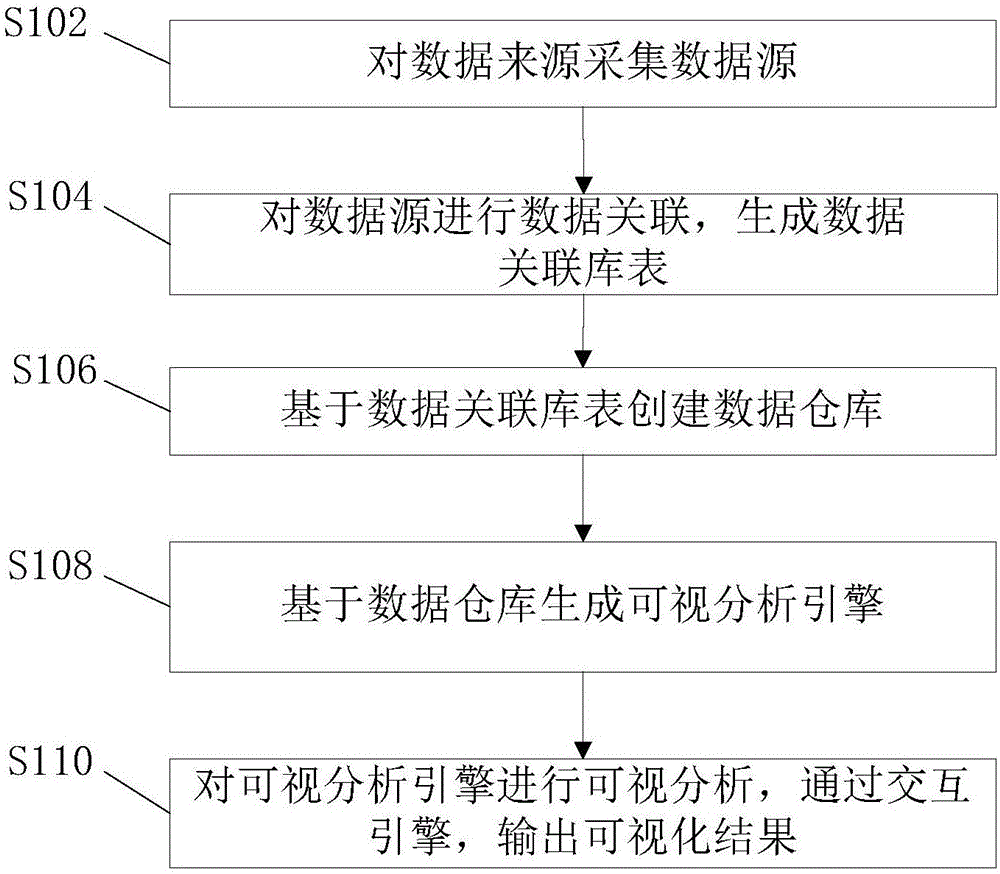
[0055] figure 1 It is a flowchart of a visual analysis method provided by an embodiment of the present invention.

[0056] Such as figure 1 As shown, the visual analysis method includes the following steps:

[0057] S102: Collect the data source from the data source.

[0058] Specifically, the data source is collected from the original data source. It should be noted that data collection can be achieved through configuration, and the original data includes external data and internal business system data.

[0059] Data sources include structured data, semi-structured data and unstructured data. Structured data refers to instant data, stored in a database, and can be logically expressed in a two-dimensional table structure. Compared with structured data, data that is inconvenient to use two-dimensio...

Example Embodiment

[0102] Example two

[0103] The embodiment of the present invention provides a visual analysis system, which can be used for data display based on big data.

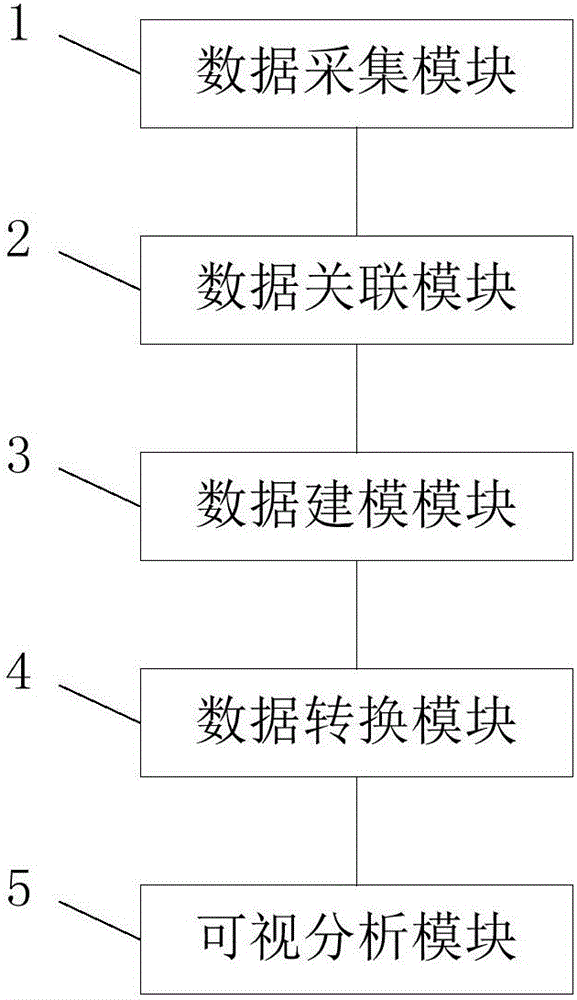
[0104] Such as image 3 As shown, the visual analysis system includes a data acquisition module 1, a data association module 2, a data modeling module 3, a data conversion module 4, and a visual analysis module 5.

[0105] The data collection module 1 is used to collect data sources from data sources. Furthermore, data sources include structured data, semi-structured data and unstructured data. For mainstream databases such as Oracle, SQL Server, and My SQL, data sources are collected by data interface access.

[0106] For text type files such as Excel, CSV, JSON, etc., data import is used to collect data sources, which can largely solve the difficult problem of sorting out logs, reports and other files accumulated by customers for many years.

[0107] The data association module 2 is used for data association of data sources to...


PUM


Abstract

The invention discloses a visual analysis method and system, and belongs to the field of big data visual analysis. The visual analysis method comprises the steps of collecting data sources for data sources; performing data association on the data sources, and generating a data association library list; on the basis of the data association library list, creating a data library; on the basis of the data library, generating a visual analysis engine; performing visual analysis on the visual analysis engine, and outputting a visual result through an interaction engine. According to the technical scheme, efficient data analysis can be achieved, a project period can be shortened, and data visual analysis and presentation can be achieved.

Description

technical field [0001] The invention relates to the technical field of big data visual analysis. More specifically, it relates to a visual analysis method and system. Background technique [0002] With the continuous development of information application, modern enterprises will encounter a lot of data in the process of production and operation, and have accumulated massive data in projects, and the data is still growing rapidly for a long time. These data have become an intangible asset of the enterprise . How to make reasonable and effective use of data to obtain knowledge and guidance beneficial to enterprise development is a research hotspot in the field of business intelligence, and it is also one of the problems that modern enterprises must face in the development process. [0003] Business Intelligence (BI), which is a complete set of solutions, is used to effectively integrate existing data in the enterprise, quickly and accurately provide reports and propose deci...

Claims


Application Information

Patent Timeline
IPC IPC(8): G06F17/30
CPCG06F16/284
Inventor 冯一村张玉杰高隐
Owner 冯一村
Why Eureka
Try Eureka