Vehicle demand thermodynamic diagram generation method and device thereof

A heat map and demand technology, applied in the fields of filling planes with attributes, instruments, data processing applications, etc., can solve the problem of poor accuracy and practicability of heat maps, unfavorable users to know the specific location of the hot area of ​​vehicle demand, and unfavorable users to know the specific location. and other issues to achieve the effect of improving accuracy and practicability

Inactive Publication Date: 2017-04-19
XIANFENG ZHIDAO BEIJING TECH CO LTD
View PDF5 Cites 47 Cited by
  • Summary
  • Abstract
  • Description
  • Claims
  • Application Information

AI Technical Summary

Problems solved by technology

[0003] In the prior art, the traditional thermal map is divided by differential rendering of the map, or the grid division of the map to perform thermal division; wherein, the method of differential rendering of the map is to display the vehicles in the corresponding area in different colors on the map However, the rendering colors in this method can easily cause the map to be covered, which is not conducive to the user's knowledge of the specific location of the covered area; t

Method used


Image

  • Vehicle demand thermodynamic diagram generation method and device thereof
  • Vehicle demand thermodynamic diagram generation method and device thereof
  • Vehicle demand thermodynamic diagram generation method and device thereof

Examples


Embodiment 1

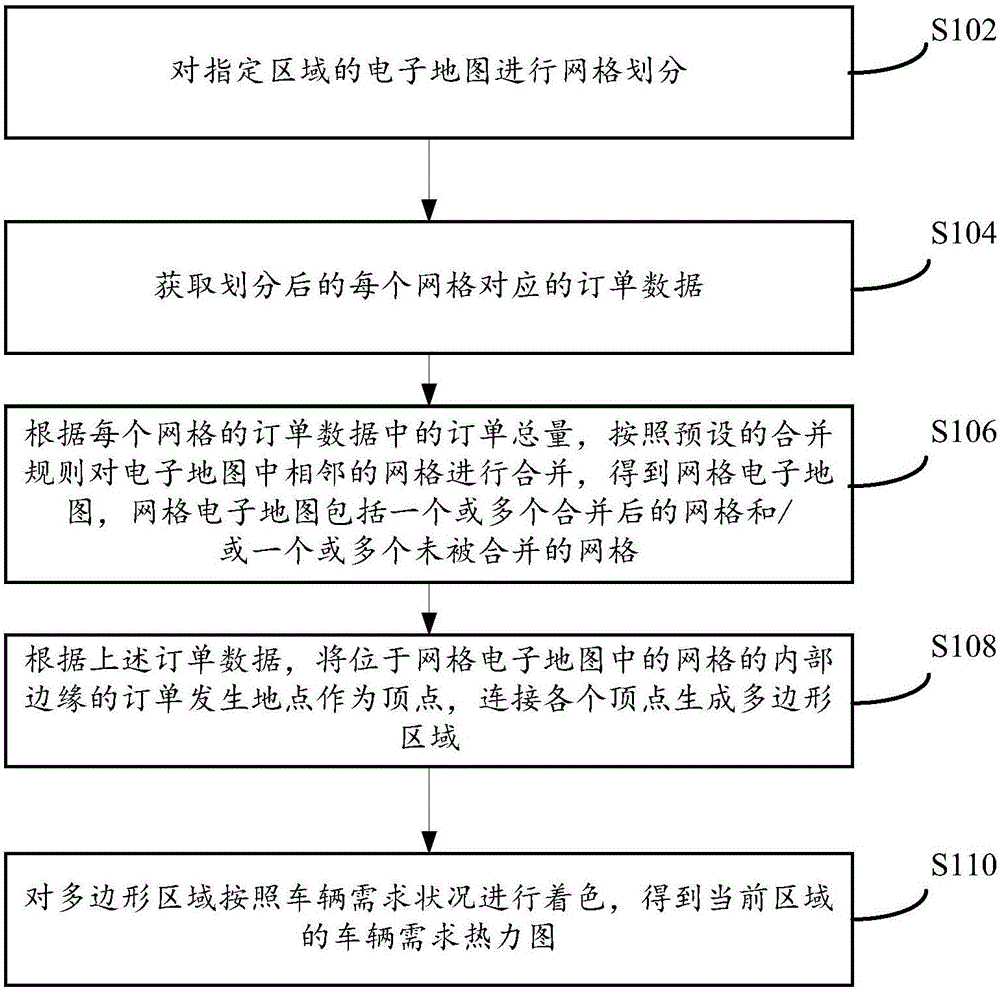
[0029] see figure 1 A flow chart of a method for generating a vehicle demand heat map is shown, and the method includes the following steps:

[0030] Step S102, performing grid division on the electronic map of the designated area; wherein, the designated area may be an urban area or a business district, etc.;

[0031] Step S104, obtaining the corresponding order data in each grid after division;

[0032] Wherein, the order data includes the place where the order occurs and the total amount of orders in the grid; the order data may be historical order data or order data updated in real time; the place where the order occurs may be the passenger placing the order location, or the location where passengers get on the bus, etc.; the above-mentioned total amount of orders may be the cumulative number of orders that occurred at all locations in the grid within a certain time range.

[0033]Step S106, according to the total amount of orders in the order data of each grid, merge ad...

Embodiment 2

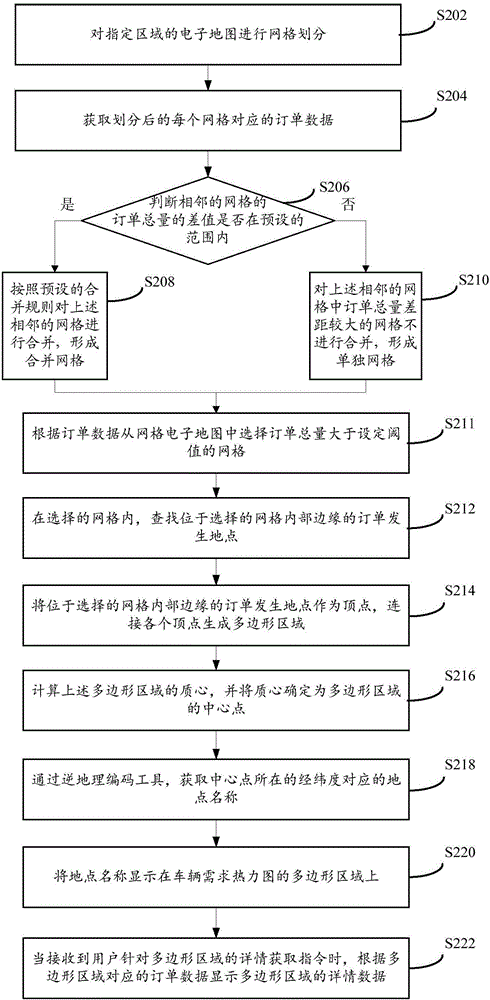
[0042] For a more detailed description of the method for generating a vehicle demand heat map provided in the first embodiment, refer to figure 2 A specific flowchart of a method for generating a vehicle demand heat map is shown, and the method includes the following steps:

[0043] Step S202, performing grid division on the electronic map of the designated area;

[0044] Step S204, acquiring order data corresponding to each grid after division;

[0045] Considering that the above grid division method is not conducive for users to view the distribution of vehicle demand, the above-mentioned grids are merged in the electronic map according to the total order amount in the order data of each grid according to the preset merging rules, include:

[0046] Step S206, judging whether the difference between the total orders of adjacent grids is within a preset range; if so, go to step S208; if not, go to step S210;

[0047] Step S208, merge the above-mentioned adjacent grids accor...

Embodiment 3

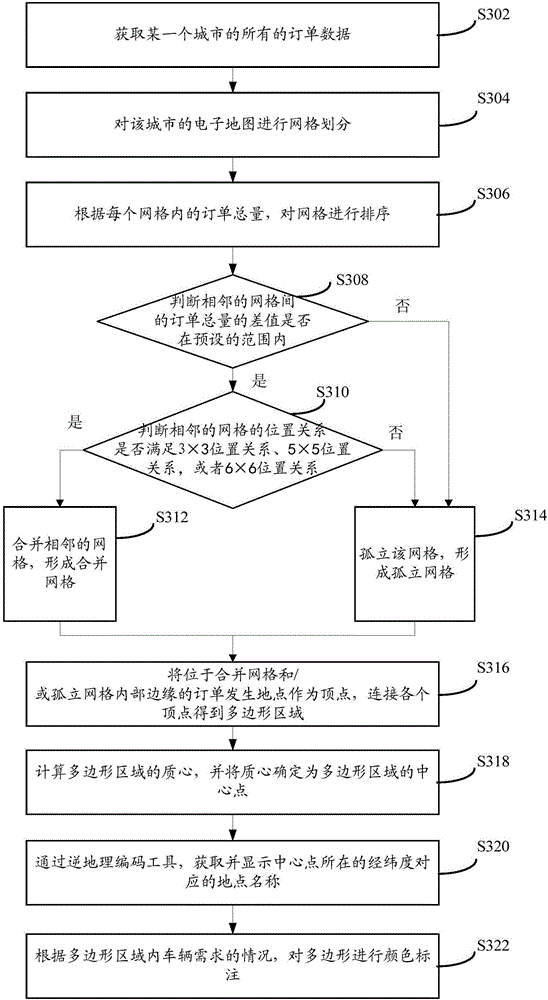
[0075] Corresponding to Embodiment 1 or Embodiment 2 above, see image 3 The specific flow chart of another vehicle demand heat map generation method shown; the method includes the following steps:

[0076] Step S302, obtain all order data of a certain city;

[0077] Step S304, perform grid division on the electronic map of the city; wherein, the grid division standard is GEO HASHCODE 5 digits;

[0078] Step S306, sort the grids according to the total amount of orders in each grid; wherein, the sorting order is from high to low;

[0079] Step S308, judging whether the difference between the total orders of adjacent grids is within a preset range, if so, go to step S310; if not, go to step S314;

[0080] Step S310, determine whether the positional relationship of the adjacent grids satisfies the 3×3 positional relationship, the 5×5 positional relationship, or the 6×6 positional relationship, if so, go to step S312; if not, go to step S314;

[0081]Step S312, merge adjacent g...


PUM


Abstract

The invention provides a vehicle demand thermodynamic diagram generation method and a device thereof and relates to the thermodynamic diagram technology field. The method comprises the following steps of carrying out grid division on an electronic map in an assigned area; acquiring order data corresponding to each divided grid; according to an order total amount in the order data of each grid, and based on a preset merging rule, merging the adjacent grids in the electronic map and acquiring an electronic grid map, wherein the preset merging rule includes rules of the order total amount in the grids and an adjacent position relation among the grids; according to the order data, taking an order generation place of an internal portion edge of each grid in the electronic grid map as a peak, and connecting each peak so as to generate a polygon area; and coloring the polygon area according to a vehicle demand and acquiring a vehicle demand thermodynamic diagram of a current area. In the invention, accuracy and practicality of the vehicle demand thermodynamic diagram are increased.

Description

technical field [0001] The present invention relates to the technical field of heat maps, and in particular, to a method and device for generating a heat map of vehicle demand. Background technique [0002] With the high development of Internet technology and the popularization of smart devices, Internet car-hailing services are more and more accepted by the public. In order to allocate vehicles reasonably, both car-hailing companies and vehicle drivers need to know the vehicle conditions at various locations in the relevant area (for example, an urban area) in a timely and accurate manner to meet the user's vehicle needs; the distribution of vehicle needs Usually represented by a heatmap. [0003] In the prior art, the traditional heat map is thermally divided by performing differential rendering on the map, or dividing the map into grids; wherein, the method of differential rendering of the map is to display vehicles in the corresponding area on the map in different color...

Claims


Application Information

Patent Timeline
IPC IPC(8): G06T11/40G06Q10/02G06Q30/02G06Q50/30
CPCG06T11/40G06Q10/025G06Q30/0201G06Q50/30
Inventor 李欣罗毅王洪磊
Owner XIANFENG ZHIDAO BEIJING TECH CO LTD
Why Eureka
Try Eureka