Statistical representation method supporting free combination and nesting of data in relational database

A technology that supports relationships and databases, applied in the field of data visualization, can solve problems such as spending a lot of development time and energy, complex expressions, and weak functions

Active Publication Date: 2017-04-26
深圳市睿捷软件技术有限公司
View PDF3 Cites 15 Cited by
  • Summary
  • Abstract
  • Description
  • Claims
  • Application Information

AI Technical Summary

Problems solved by technology
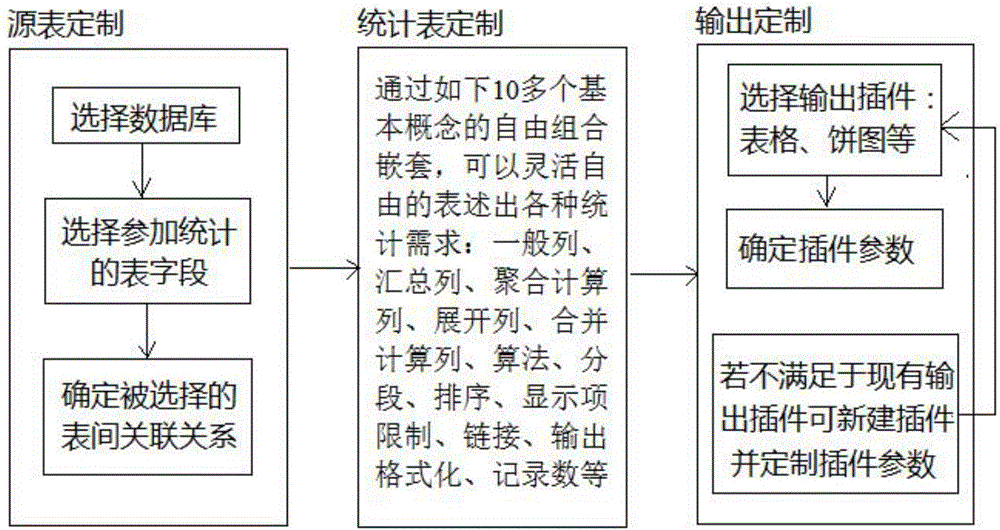
[0002] At present, there is a lack of a set of statistical components or software that is highly versatile and can be widely used in various relational databases. A large number of statistical charts are written by programmers. From SQL statements to program processing to interface display, etc., it takes a lot of development time and effort.
Various related technical tools are either difficult to understand or too simple and weak in function, such as SAS and Matlab, they can indeed provide powerful enough statistical functions, but many times you have to use their programming languages ​​to complete the charts you want, For the purpose of completing statistical charts, using these tools does not bring much convenience compared to directly using other programming languages; while other low-end tools, such as Excel, have very weak functions and complex expressions, making it difficult to Integrate with other systems
The root cause of all these problems is that we lack a set of tools that can clearly express and process statistical needs. Because statistical needs are complex and diverse, it is a great difficulty to find a general enough statistical expression method itself, and to ensure The program can calculate and output results according to this expression method, and it needs to consider many complicated logic problems

Method used


Image

  • Statistical representation method supporting free combination and nesting of data in relational database
  • Statistical representation method supporting free combination and nesting of data in relational database
  • Statistical representation method supporting free combination and nesting of data in relational database

Examples


Embodiment example 2

[0043] Implementation case two, the segmentation steps in the organizational expression of the statistical table are: (1) select the segmentation type (linear segmentation, segmentation by set, or segmentation by time attribute), (2) select the segmentation method, Such as Figure 8 and 9 Shown: running effect:

Embodiment example 3

[0044] Implementation case three, the generation cycle setting steps in the organization expression of the statistical table are: (1) select the constraint time, any date-type column in the source table can be selected for the constraint time (it is not required to appear in the column of the statistical table ), (2) enter the length of time and select the time unit, (3) set the generation cycle (yearly, monthly, weekly, daily, etc.), such as Figure 10 Shown:

[0045] Further, the generation cycle setting in the statistical table organization expression, (1) If the user only sets the generation cycle, and does not set the constraint time, time length and time unit, the system will automatically run and generate the statistical table according to the generation cycle, and its data is All data in the source table is not filtered by time constraints during runtime; (2) If the user sets the constraint time, time length and time unit, and does not set the generation cycle, the sys...

Embodiment example 4

[0046] Implementation case 4, the link setting steps in the organization expression of the statistical table are: (1) select the link type, (2) if the link in the system is selected in step 1, the statistical table and display mode defined in the system must be selected, if In step 1, if you choose a link outside the system, you must enter the link address and ensure that the address is valid. (3) Select the opening method. (4) If you choose the pop-up box method to open in step 3, you must enter the size of the pop-up box window. If you choose the jump method It is not necessary to open, such as Figure 11 Shown:

[0047] The effect of clicking the link:


PUM


Abstract

The invention discloses a statistical representation method supporting free combination and nesting of data in a relational database. The process comprises the steps of source table customization, statistical table customization and output customization. In the step of defining a statistical table by the adoption of the representation method, a database is selected, wherein the program display database contains all tables and fields, a user selects needed tables and fields, a program prompts the user to confirm the incidence relation among the tables, and a source table can be generated after the user clicks for determination; the user can organize various statistical tables according to his / her own demands with the source table. According to the representation method, by decomposing the statistical demands of the user, the method can be applied to realization of statistical table components and has unprecedentedly powerful functions, almost any statistical table can be realized by the adoption of the statistical representation method, the method can be applied to realization of a statistical table system, the statistical table customization process turns into a simple and clear process, and the method supports direct statistical analysis on arbitrary relevant data in the database by the user.

Description

technical field [0001] The invention relates to the field of data visualization, in particular to a statistical expression method supporting free combination and nesting of relational database data. Background technique [0002] At present, there is a lack of a set of statistical components or software that is highly versatile and can be widely used in various relational databases. A large number of statistical charts are written by programmers. From SQL statements to program processing to interface display, etc., it takes a lot of development time and effort. Various related technical tools are either difficult to understand or too simple and weak in function, such as SAS and Matlab, they can indeed provide powerful enough statistical functions, but many times you have to use their programming languages ​​to complete the charts you want, For the purpose of completing statistical charts, using these tools does not bring much convenience compared to directly using other progr...

Claims


Application Information

Patent Timeline
Patent Type & Authority Applications(China)
IPC IPC(8): G06F17/30
CPCG06F16/284
Inventor 朱伟统
Owner 深圳市睿捷软件技术有限公司
Why Eureka
Try Eureka