Short-term photovoltaic power prediction method based on EWT-KMPMR (empirical wavelet transform and kernel minimax probability machine classification)
A power prediction and photovoltaic technology, applied in prediction, instrument, data processing applications, etc., can solve the problems of mode aliasing, large amount of calculation, and large number of decomposed modes.
- Summary
- Abstract
- Description
- Claims
- Application Information
AI Technical Summary
Problems solved by technology
Method used
Image
Examples
Embodiment 1
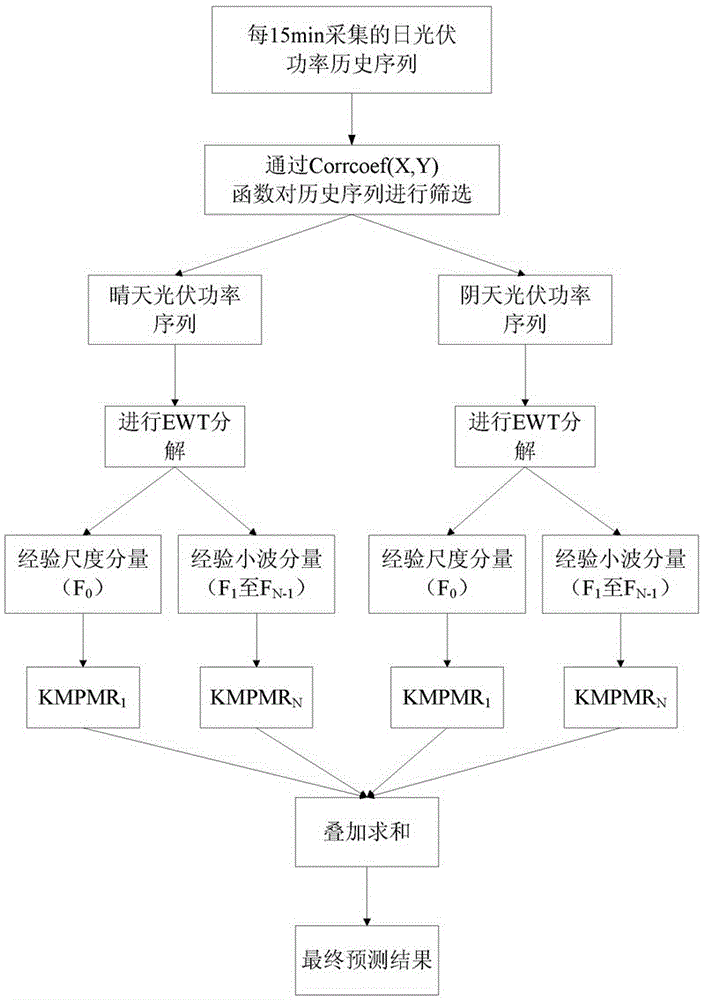
[0092] Embodiment 1: as attached figure 1 As shown, the short-term photovoltaic power prediction method based on EWT-KMPMR includes the following steps:
[0093] Step 1: Use the Corrcoef(X,Y) function to filter the daily photovoltaic power history series collected every 15 minutes, and select the series with high correlation with the day to be predicted as training samples. The training samples include sunny day photovoltaic power series and cloudy day day photovoltaic power sequence;
[0094] Step 2: Use the EWT method to decompose the selected sunny-day photovoltaic power sequence and cloudy-day photovoltaic power sequence respectively to obtain the empirical scale component F 0 and the empirical wavelet component F 1 to F N-1 ;
[0095] Step 3: Use the KMPMR method to analyze the empirical scale component F 0 and the empirical wavelet component F 1 to F N-1 Construct the corresponding prediction model, and the output of each component prediction model is the predicti...
Embodiment 2
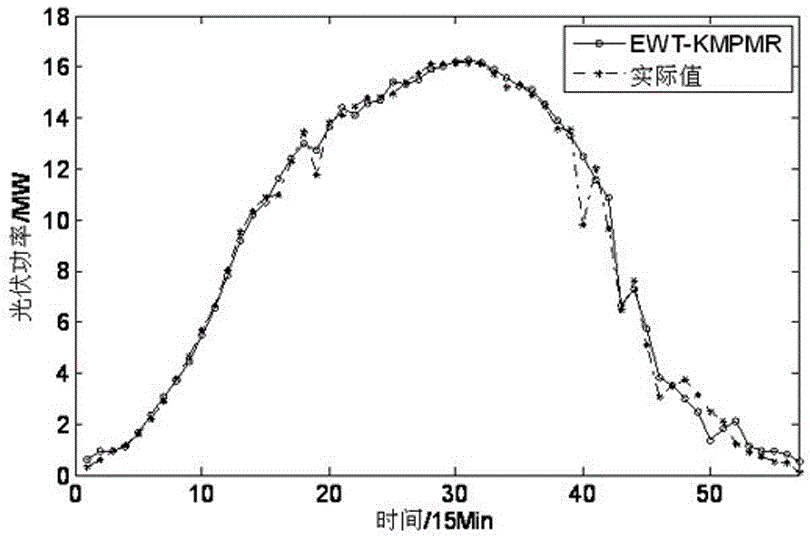
[0174] Embodiment 2: as table 1, 2 and attached figure 1 , 2 , 3, 4, 5, and 6, taking the short-term photovoltaic power forecast in Aksu area as an example, the short-term photovoltaic power forecast process in Aksu area is as follows:
[0175] Step 1: Use the Corrcoef(X,Y) function to filter the historical data of sunny photovoltaic power data in June 2015 in the Aksu area, and use June 23 as the benchmark to obtain the correlation calculation shown in Table 1 As a result, except for individual sample points on June 7, the variation trend of each similar day is basically consistent with the photovoltaic output, so the data of the first 4 days in Table 1 are selected as the training sample, and the data of June 23 is used as the test sample;
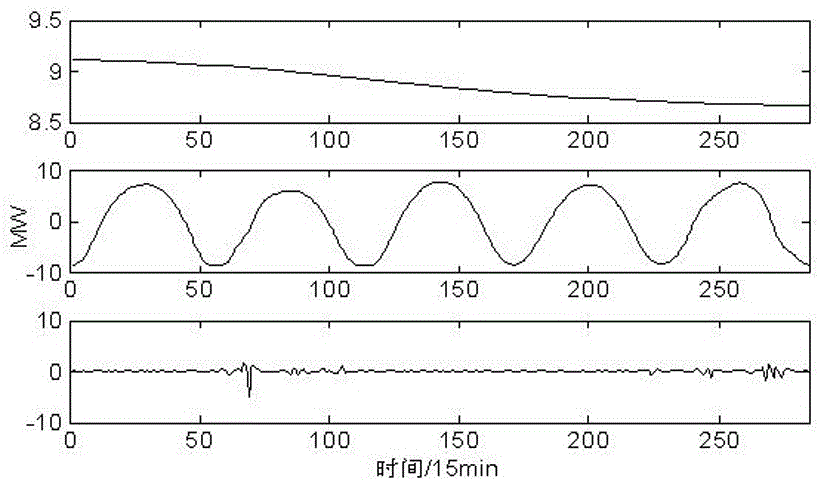
[0176] Step 2: Use the EWT method to decompose the selected sunny-day photovoltaic power sequence for 5 days (57 sample points with an interval of 15 minutes from 07:45 to 21:45 every day, a total of 285 sample points) to obtain the emp...
Embodiment 3
[0182] Embodiment 3: as table 3,4 and appended figure 1 , 7 , 8, 9, 10, and 11, taking the short-term photovoltaic power forecast in Aksu area as an example, the short-term photovoltaic power forecast process in Aksu area is as follows:
[0183] Step 1: Use the Corrcoef(X,Y) function to filter the historical data of cloudy photovoltaic power data in July 2015 in the Aksu area, and use July 31 as the benchmark to obtain the correlation shown in Table 3 As a result of the calculation, the training samples with high correlation with the day to be predicted are selected, so the data of the 26th and 28th are selected as the training samples, that is, the cloudy day photovoltaic power sequence;
[0184] Step 2: Use the EWT method to decompose the selected cloudy photovoltaic power series on the 26th and 28th (57 sample points with an interval of 15 minutes from 07:45 to 21:45 every day, a total of 171 sample points), and get empirical scale component F 0 and the empirical wavelet...
PUM
 Abstract
Description
Claims
Application Information
 - R&D
- Intellectual Property
- Life Sciences
- Materials
- Tech Scout
- Unparalleled Data Quality
- Higher Quality Content
- 60% Fewer Hallucinations
Browse by: Latest US Patents, China's latest patents, Technical Efficacy Thesaurus, Application Domain, Technology Topic, Popular Technical Reports.
© 2025 PatSnap. All rights reserved.Legal|Privacy policy|Modern Slavery Act Transparency Statement|Sitemap|About US| Contact US: help@patsnap.com


