Visualized display method for energy efficiency index decomposition

An indicator and energy-efficiency technology, applied in other database browsing/visualization, energy-saving calculation, climate sustainability, etc., to reduce statistical complexity, facilitate rapid positioning, and improve accuracy

Inactive Publication Date: 2017-09-22
NR ELECTRIC CO LTD +1
View PDF10 Cites 5 Cited by
  • Summary
  • Abstract
  • Description
  • Claims
  • Application Information

AI Technical Summary

Problems solved by technology

It is convenient for analysts to discover and locate production management problems in time

Method used


Image

  • Visualized display method for energy efficiency index decomposition
  • Visualized display method for energy efficiency index decomposition
  • Visualized display method for energy efficiency index decomposition

Examples


Embodiment Construction

[0030] The technical scheme of the present invention will be described in further detail below in conjunction with the accompanying drawings and specific embodiments, so that those skilled in the art can better understand the present invention and implement it, but the examples given are not intended to limit the present invention.

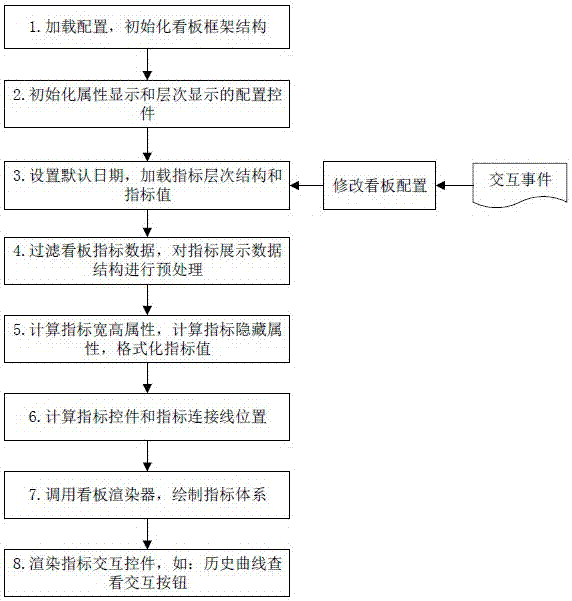
[0031] A visual display method for energy efficiency index decomposition, comprising the following steps:

[0032] Step 1. Establish index architecture information and memory data model, wherein the index architecture information includes hierarchical relationship among indexes and attributes of index nodes.

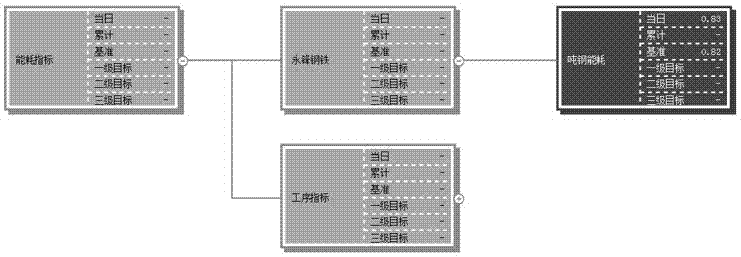
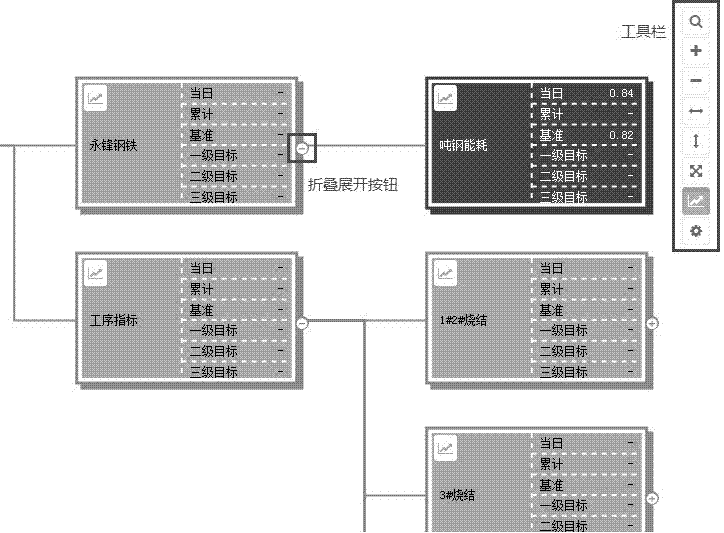
[0033] When applied, such as figure 1 As shown, the system first loads the default configuration and initializes the kanban framework (that is, the kanban control), then loads the indicator architecture information and indicator values, and generates the kanban display data structure according to the default configuration information.

[00...


PUM


Abstract

The invention discloses a visualized display method for energy efficiency index decomposition. The method is characterized by comprising the steps that 1, index system structure information and a memory data model are established, wherein the index system structure information comprises a hierarchical structure relation between indexes and properties of index nodes; 2, an index layout position is calculated according to the superior and subordinate hierarchical relation between the indexes, index content, a font size, the frame decoration width of the index notes and the width-height spacing of the index nodes; and 3, an index billboard is rendered according to the width and height of canvas, a font, a font size and index layout position information, and the index nodes and an interactive control are rendered to the canvas by the adoption of an HTML in combination with an SVG mode, wherein SVG components are used to display all static elements on the billboard, and HTML elements are used to realize dynamic interaction. The index hierarchical decomposition billboard provides a dynamic interaction method, and it is convenient for a user to browse index information layer by layer and level by level.

Description

technical field [0001] The invention relates to a visual display method for energy efficiency index decomposition. Background technique [0002] In the existing technology, the display of the energy management and control index system is only a static display, which cannot realize dynamic interaction, and is inconvenient to decompose the energy efficiency index, which is not conducive to the timely discovery and positioning of production management problems by analysts. Contents of the invention [0003] In view of the above problems, the present invention provides a visual display method for the decomposition of energy efficiency indicators. The indicator hierarchical decomposition kanban provides a dynamic interactive method, which is convenient for users to browse the indicator information layer by layer; further, the energy efficiency indicators are decomposed through the analytic hierarchy process, and the indicators meet the standards. conditions and decompose to for...

Claims


Application Information

Patent Timeline
Patent Type & Authority Applications(China)
IPC IPC(8): G06Q10/06G06F17/30
CPCG06F16/904G06Q10/06393Y02D10/00
Inventor 陈华杰苏恒循金浩谷峰张长开李华解凯姜彬
Owner NR ELECTRIC CO LTD
Why Eureka
Try Eureka