Visualization method and device for electrical distance of power system

A technology of electrical distance and power system, which is applied in the direction of circuit devices, electrical components, AC network circuits, etc., and can solve problems such as the inability to directly express the stability characteristics of the power grid

Pending Publication Date: 2017-10-03
CHINA ELECTRIC POWER RES INST +2
View PDF2 Cites 9 Cited by
  • Summary
  • Abstract
  • Description
  • Claims
  • Application Information

AI Technical Summary

Problems solved by technology

Most of the existing power system visualization methods use geographic maps or single-line diagrams to represent the connection relationship between devices, which are mainly used for monitoring the operation status of the power grid, but cannot directly represent the stability characteristics of the power grid.

Method used


Image

  • Visualization method and device for electrical distance of power system
  • Visualization method and device for electrical distance of power system
  • Visualization method and device for electrical distance of power system

Examples


Embodiment

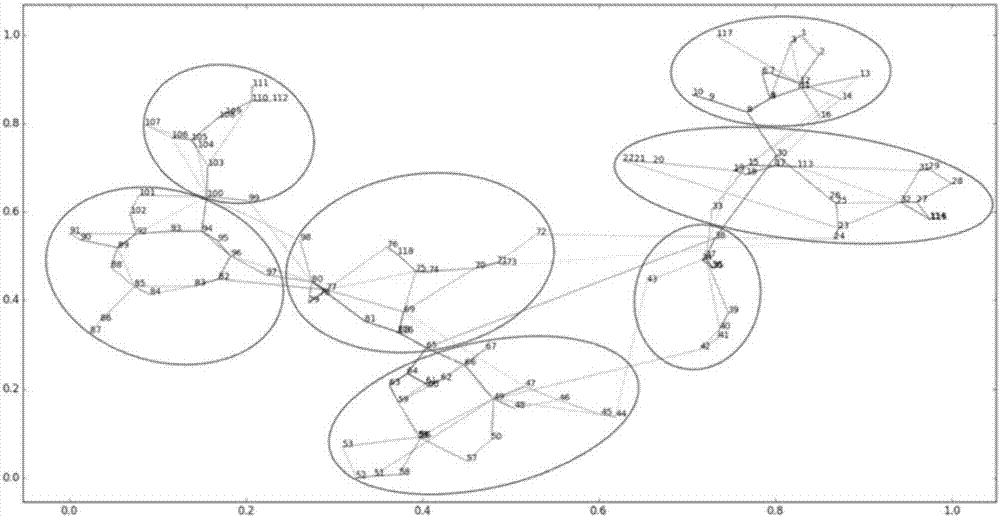
[0102] The IEEE-118 node standard test system is used. The system contains 118 nodes, 54 of which are generator nodes, in addition to 191 AC line branches and 9 transformer branches. In the fully connected mode, the algorithm of the present invention can obtain figure 1 The visualization results shown in the Kmeans cluster analysis are further used to obtain 7 clustering results. As shown in Table 1, it can be seen that the clustering results are consistent with the visualization effect, which means that the visualization method of the present invention can be very good Reflect the electrical distance between the nodes and the closeness between each other.

[0103] Table 1 Kmeans classification results of the original IEEE-118 system

[0104] Group No

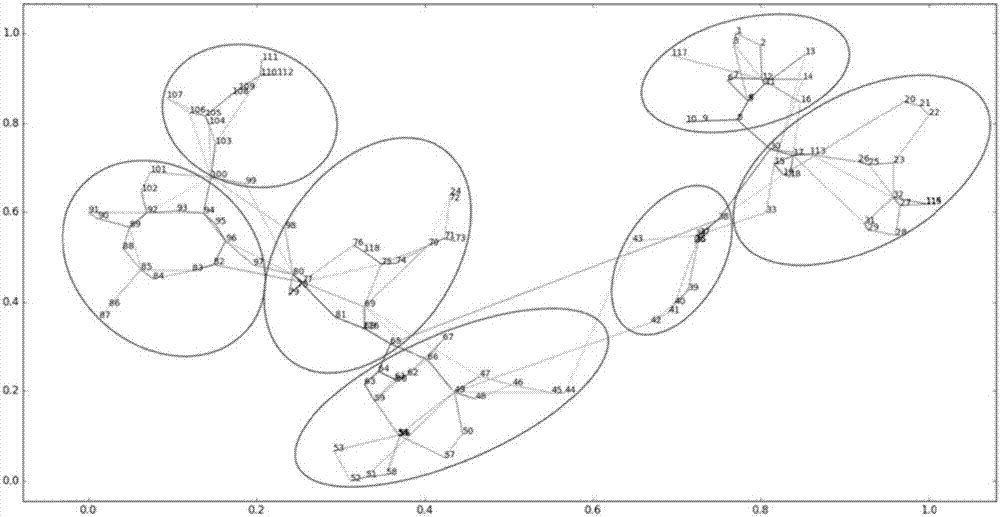
[0105] Further disconnect the branch between node 23 and node 24, and the rest remains unchanged. The algorithm analysis of the present invention can obtain figure 2 Visualization results, comparison figure 1 It can be seen th...


PUM


Abstract

The invention provides a visualization method and device for electrical distance of a power system. The method comprises the steps of calculating a self-impedance matrix of a node according to a power grid topology and a running parameter, which are acquired in advance, of the power system by a node admittance matrix inversion method; mapping high-dimensional space data to a low-dimensional space by a t-SNE algorithm according to the self-impedance matrix to calculate the electrical distance; and drawing a pattern relevant to the electrical distance of the power system according to node coordinates obtained by calculation of the low-dimensional space. The device comprises a matrix building unit, a dimension reduction unit and a drawing unit. With the technical scheme provided by the invention, the tightness degree among different equipment can be fully displayed, and an intuitive object can be given to an operator.

Description

Technical field [0001] The technical scheme provided by the present invention relates to the field of large power grid stability and control, and specifically relates to a method and device for visualizing the electrical distance of a power system. Background technique [0002] With the rapid improvement of the economic level, the demand for electricity is also increasing. In order to adapt to the economic development, major projects such as west-to-east power transmission, national interconnection and UHV transmission have been built, and a large AC / DC hybrid power grid has been built. With the expansion of the power grid, the security and stability of the power grid have put forward higher requirements. Multiple grid failures in the world have shown that the increase in transmission voltage levels, the expansion of the scale of interconnection and the increase in transmission capacity, the greater the harm caused by grid failures, and the more complex causes and processes of gr...

Claims


Application Information

Patent Timeline
Patent Type & Authority Applications(China)
IPC IPC(8): H02J3/00
CPCH02J3/00H02J2203/20
Inventor 史东宇胡文浩李刚于之虹黄彦浩鲁广明严剑峰吕颖高峰张军张爽李旭涛
Owner CHINA ELECTRIC POWER RES INST
Why Eureka
Try Eureka