Visual power grid current situation diagnosis and analysis system

A diagnostic analysis and status quo technology, which is applied in the field of visual power grid status diagnosis and analysis system, can solve problems such as errors in calculation results, complex calculation formulas, and manual calculation of key indicators.

Inactive Publication Date: 2017-10-24
RES INST OF ECONOMICS & TECH STATE GRID SHANDONG ELECTRIC POWER +2
View PDF5 Cites 1 Cited by
  • Summary
  • Abstract
  • Description
  • Claims
  • Application Information

AI Technical Summary

Problems solved by technology

[0003] Due to the lack of mature analysis and calculation tools, it is often necessary to manually calculate key indicators, and the calculation formula is relatively co

Method used


Image

  • Visual power grid current situation diagnosis and analysis system
  • Visual power grid current situation diagnosis and analysis system
  • Visual power grid current situation diagnosis and analysis system

Examples


Embodiment 1

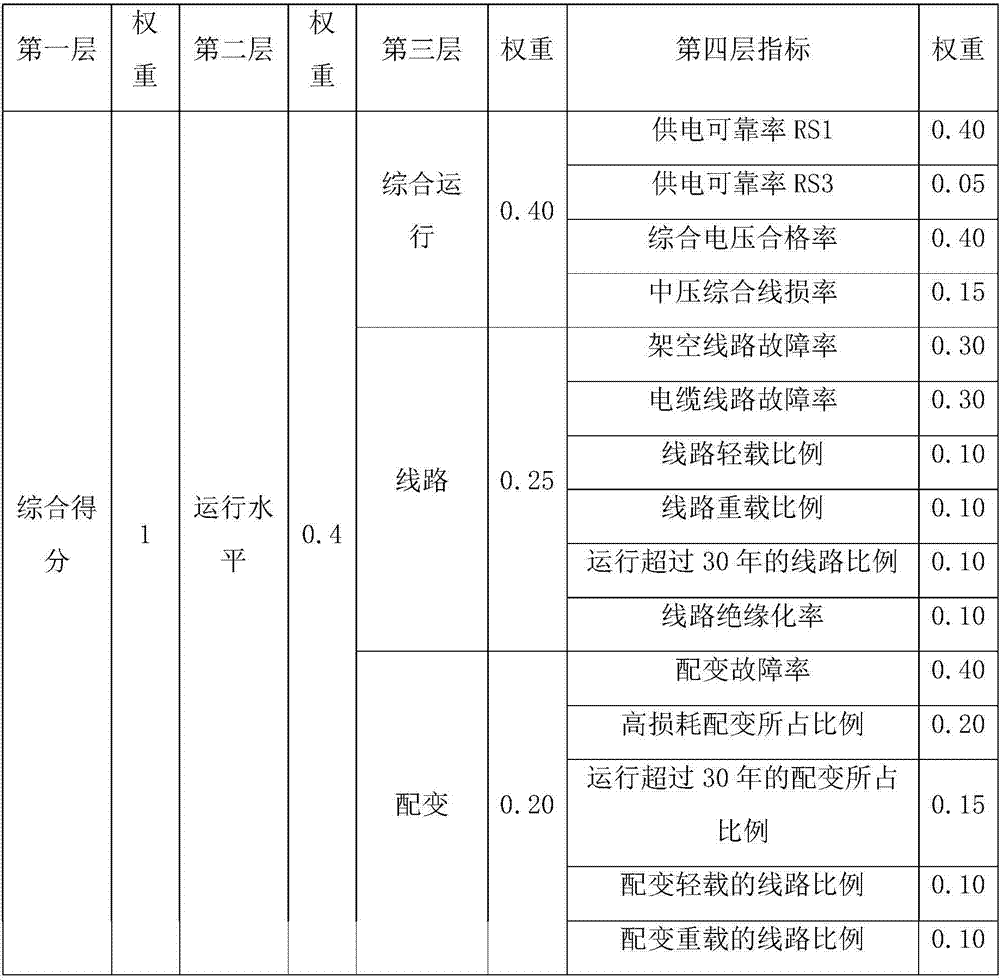
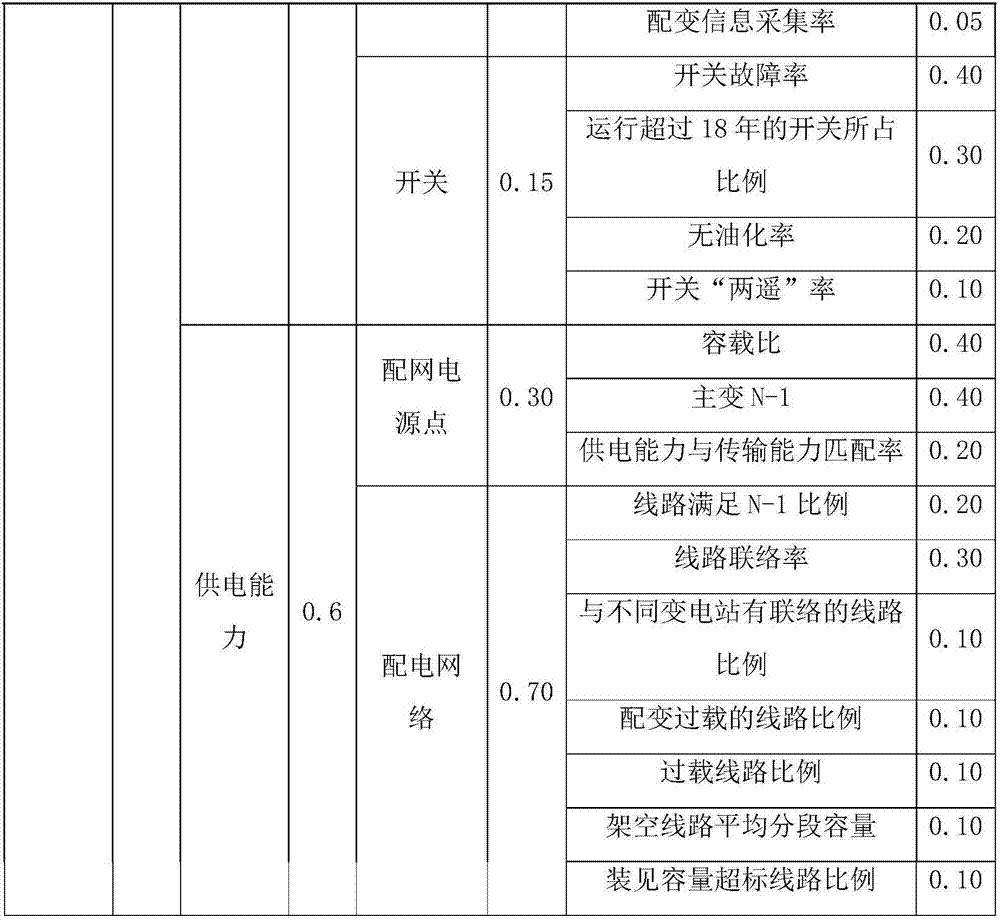
[0137] According to the present invention, the visualized power grid status quo diagnosis and analysis system is provided with four layers of evaluation indicators:

[0138] The first level is the comprehensive score of operation level and power supply capacity;

[0139] The second layer is the operation level and power supply capacity respectively;

[0140] The third layer consists of 6 parts: comprehensive operation, line, distribution transformer, switch, power point of distribution network and distribution network, among which 4 parts of comprehensive operation, line, distribution transformer and switch belong to the evaluation of operation level, distribution network power supply The two parts of the point and distribution network are subject to the assessment of power supply capacity;

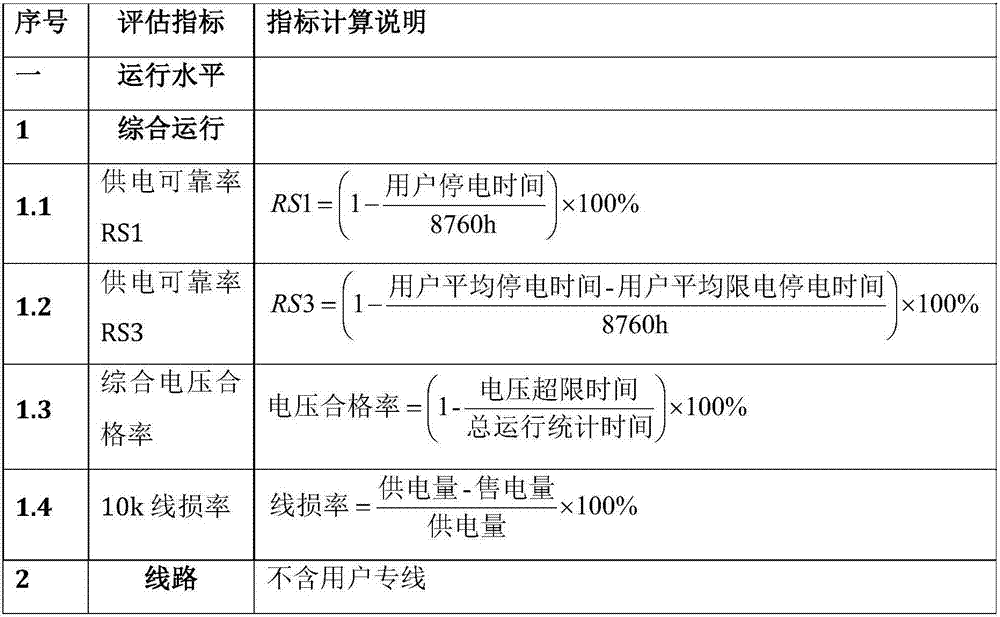
[0141] The fourth layer is the specific evaluation indicators of each part;

[0142] The comprehensive score of each layer of indicators is obtained by weighting and summing the scores ...


PUM


Abstract

The invention relates to the technical field of power grid planning, and specifically relates to a visual power grid current situation diagnosis and analysis system. The system is characterized in that four layers of evaluation indexes are set, wherein the first layer is a comprehensive score of the operation level and the power supply capability, the second layer is the operation level and the power supply capability, the third layer is comprehensive operations, lines, distribution transformers, switches, distribution network power supply points and a distribution network, the comprehensive operations, the lines, the distribution transformers and the switches belong to evaluation for the operation level, the distribution network power supply points and the distribution network belong to evaluation for the power supply capability, the fourth layer is specific evaluation indexes for each part; and a comprehensive score of each layer of indexes is acquired through performing summation after being weighted by a score of the lower layer, and a comprehensive score of the operation level and the power supply capability of an evaluated region is acquired finally by performing layer-by-layer weighting and summation on all indexes. Calculation formulas for each layer of evaluation indexes are preset in a processor and a result is calculated automatically after required data is obtained. The system performs visual and clear division on various indexes, shortens the calculation period and improves the calculation accuracy.

Description

technical field [0001] The invention relates to the technical field of power grid planning, in particular to a visual power grid status quo diagnosis and analysis system. Background technique [0002] At present, most of the power grid diagnosis and analysis indicators come from other systems. After obtaining the data, analysts need to calculate and analyze according to the characteristics of power grid planning business, so as to obtain a comprehensive evaluation of the power grid status, so as to diagnose the weak links of the power grid in a timely manner. Power grid diagnosis and analysis indicators include comprehensive diagnosis, transmission network diagnosis, and distribution network diagnosis. Each category contains several indicators, and each indicator is displayed in different types. Therefore, there are many categories and a large number of indicators to be displayed. . [0003] Due to the absence of mature analysis and calculation tools, it is often necessary ...

Claims


Application Information

Patent Timeline
IPC IPC(8): G06Q10/06G06Q50/06
CPCG06Q10/06393G06Q50/06Y04S50/16
Inventor 吴健杨波吴奎华杨慎全冯亮李凯邓少治庞怡君
Owner RES INST OF ECONOMICS & TECH STATE GRID SHANDONG ELECTRIC POWER
Why Eureka
Try Eureka