
Network service anomaly detection method based on distributed probe monitoring

A technology for network services and network anomalies, which is applied in the field of network service anomaly detection based on distributed probe monitoring, and can solve the problems of complex network traffic statistics characteristics and characterization of network traffic statistics characteristics.

Active Publication Date: 2017-12-15
LIAOYANG POWER SUPPLY COMPANY OF STATE GRID LIAONING ELECTRIC POWER SUPPLY +2
View PDF5 Cites 22 Cited by
  • Summary
  • Abstract
  • Description
  • Claims
  • Application Information

AI Technical Summary

Problems solved by technology

[0006] However, the increasing types of network services and the increasing scale of the network make the statistical characteristics of network traffic more complex, so it is difficult for a simple statistical model to fully describe the statistical characteristics of current network traffic

Method used


Image

  • Network service anomaly detection method based on distributed probe monitoring
  • Network service anomaly detection method based on distributed probe monitoring
  • Network service anomaly detection method based on distributed probe monitoring

Examples


Embodiment 1

[0103] Directly compare Abilene and The actual flow of the backbone network and the estimated value obtained by the network service anomaly detection method based on distributed probe monitoring of the present invention.

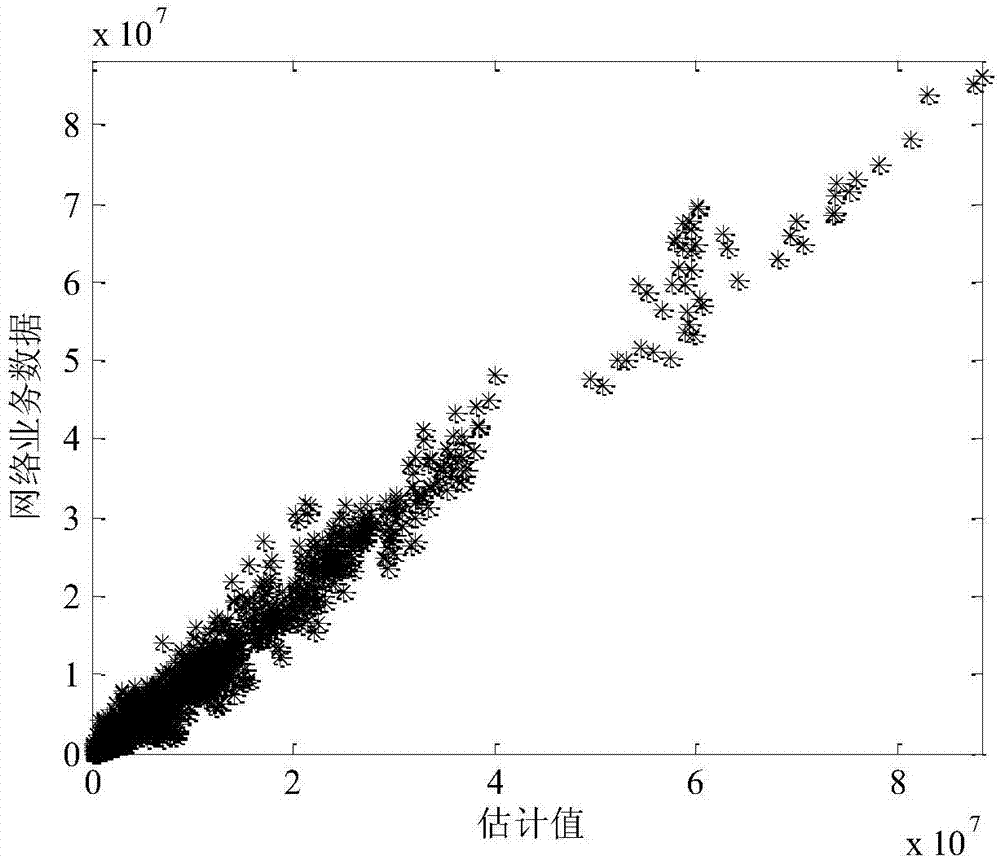
[0104] image 3 with 4 shows Abilene and The comparison between the actual values ​​of the two network data flows and the estimated value of the network data flows obtained by using the method for estimating the flow matrix of the present invention. The x-axis and y-axis respectively represent the estimated value and the real value of network data traffic, from image 3 It can be seen that the BN algorithm can accurately estimate the Abilene network data flow, but there are still a small amount of negative estimates. For network data, such as Figure 4 As shown, the BN algorithm has a large estimation error, especially a more obvious negative estimation.

Embodiment 2

[0106] Evaluate the effectiveness of the algorithm;

[0107] In the simulation, compare the BN algorithm with the SRSVD algorithm, TomoGravity algorithm and PCA algorithm. First compare the estimated bias of the four algorithms, the estimated bias of the algorithm is defined as

[0108]

[0109] Among them, X(n,t) and represent real network traffic and its estimated value, respectively.

[0110] Figure 5 It is the estimated deviation of the four algorithms for Abilene network data. The x-axis represents the ID of the OD flow, and is arranged in descending order according to the average traffic value. The y-axis represents the estimated deviation of the algorithm. It can be seen that as the average value of the OD flow decreases, the BN algorithm and The estimated deviation of the SRSVD algorithm gradually decreases, and compared with the SRSVD algorithm, the BN algorithm has a smaller estimated deviation. In addition, the estimated deviations of the TomoGravity algorit...

Embodiment 3

[0116] Evaluate the overall performance of the algorithm;

[0117] The performance improvement ratio of the algorithm is used as a measure to evaluate the overall performance of the algorithm, and the performance improvement ratio of the algorithm is defined as

[0118]

[0119] in, with Represent the estimated value of the flow matrix obtained by algorithm a and algorithm b, respectively. Such as Figure 9 As shown, for Abilene network data, the performance improvement rates of BN algorithm compared with SRSVD algorithm, TomoGravity algorithm and PCA algorithm are 57.61%, 53.14% and 54.94%, respectively. Such as Figure 10 shown, for Network data, the performance improvement rate is 46.91%, 44.71% and 71.70%.


PUM


Abstract

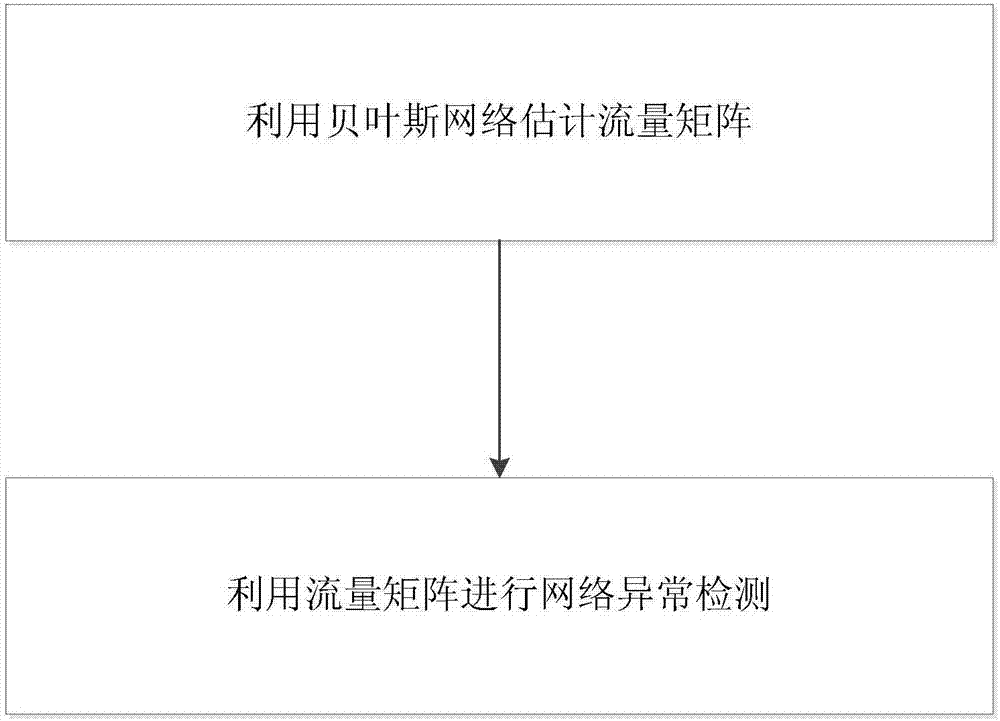
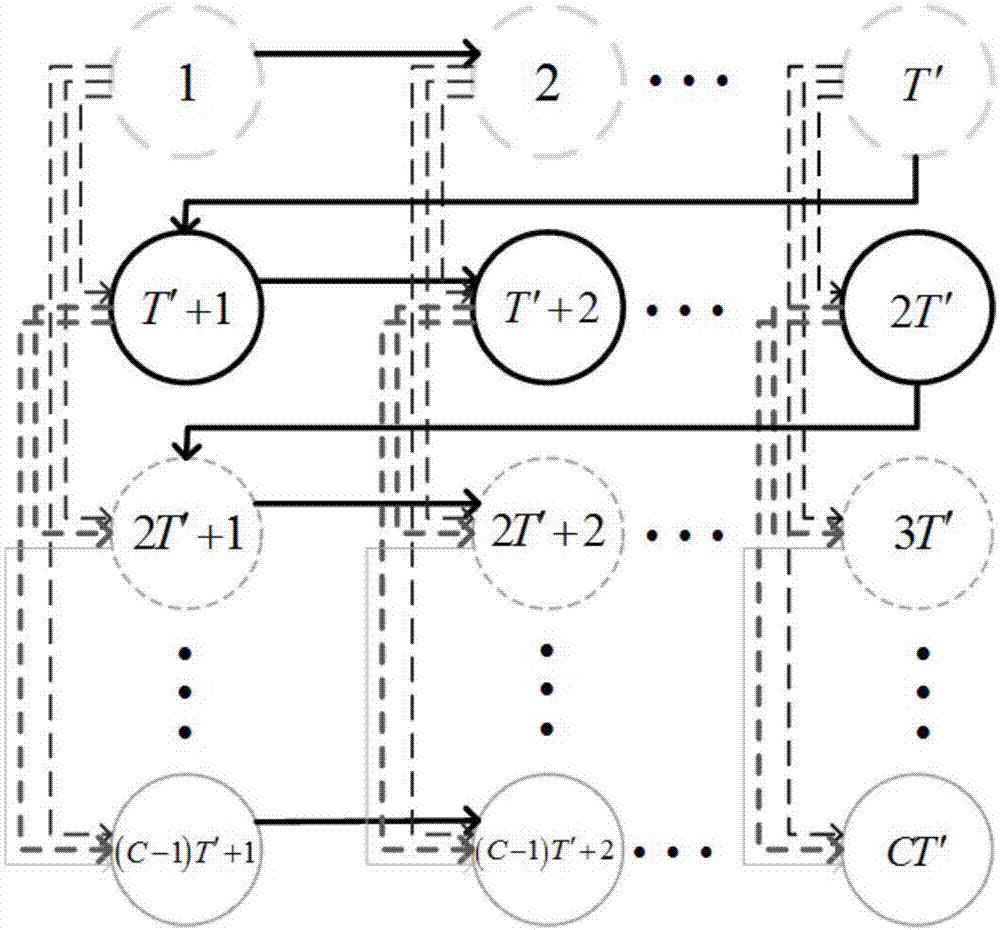
The invention discloses a network service anomaly detection method based on distributed probe monitoring. The method comprises the following steps: 1, a Bayesian network architecture is designed, and the Bayesian network architecture is used to estimate a flow matrix; and 2, the flow matrix is used for network anomaly detection. The first step comprises sub steps: the Bayesian network architecture is designed; the estimation value of the maximum posterior probability of a network parameter is calculated; the initial estimation value of the flow matrix is generated; and the flow matrix is estimated. The second step comprises sub steps: the Bayesian network performs learning through a group of network service flow training data; one flow matrix is generated randomly as a prediction factor for network agendas diagnosis; the network probes are deployed in a distributed mode to different network nodes; and the prediction factor is used for network anomaly detection. According to the network service anomaly detection method based on distributed probe monitoring, through the distributed probe monitoring mode, the network service flow anomalies in the network can be effectively detected and found out, and safe network service transmission can be realized.

Description

technical field [0001] The invention belongs to the technical field of cloud computing, and in particular relates to a network service anomaly detection method based on distributed probe monitoring. Background technique [0002] The development of information and communication technology has greatly changed human life and production methods. Services based on Internet technology such as smart grid and office automation have entered people's lives. In addition, the proposal of advanced information concepts and technologies such as smart cities and big data has played a positive role in promoting the development of human society in the future. The development of the Internet has led to a sharp increase in the network scale, and the types of services carried by the network are diversified. In particular, the rise of cloud computing and the Internet of Things has made the network a complex heterogeneous network. While the development of the network provides us with more service...

Claims


Application Information

Patent Timeline
IPC IPC(8): H04L12/24H04L29/06
CPCH04L41/145H04L63/1425
Inventor 夏菲孟凡博刘清凡王鹏焦明程杨恒郭仕滢陈国顺王艺儒邸卓高潇
Owner LIAOYANG POWER SUPPLY COMPANY OF STATE GRID LIAONING ELECTRIC POWER SUPPLY
Learn More