System and method for visually and dynamically configuring and generating diagrams

A technology of dynamic configuration and chart, applied in the field of chart processing, to achieve the effect of expanding function points, lowering the threshold, and convenient and quick operation

Inactive Publication Date: 2018-04-17
广东广业开元科技有限公司
View PDF3 Cites 16 Cited by
  • Summary
  • Abstract
  • Description
  • Claims
  • Application Information

AI Technical Summary

Problems solved by technology

Since the direct use of various excellent front-end charting tools commonly used at present requires the

Method used


Image

  • System and method for visually and dynamically configuring and generating diagrams
  • System and method for visually and dynamically configuring and generating diagrams
  • System and method for visually and dynamically configuring and generating diagrams

Examples


Embodiment 1

[0044] A system for visually and dynamically configuring and generating charts, the system comprising:

[0045] The visual editing interface includes a form configuration area for providing a chart configuration parameter form, a chart rendering area for rendering a corresponding chart according to the input chart configuration parameters and / or configuration codes, and a display area corresponding to the input chart configuration parameters The configuration code display area of ​​the configuration code; wherein, the form configuration area includes a basic configuration area and a parameter configuration area;

[0046] The operation behavior listener is used to monitor the input basic configuration parameters determined in the form of the basic configuration area, and dynamically load and render the form of the corresponding parameter configuration area according to the basic configuration parameters obtained through monitoring;

[0047] The configuration parameter verificat...

Embodiment 2

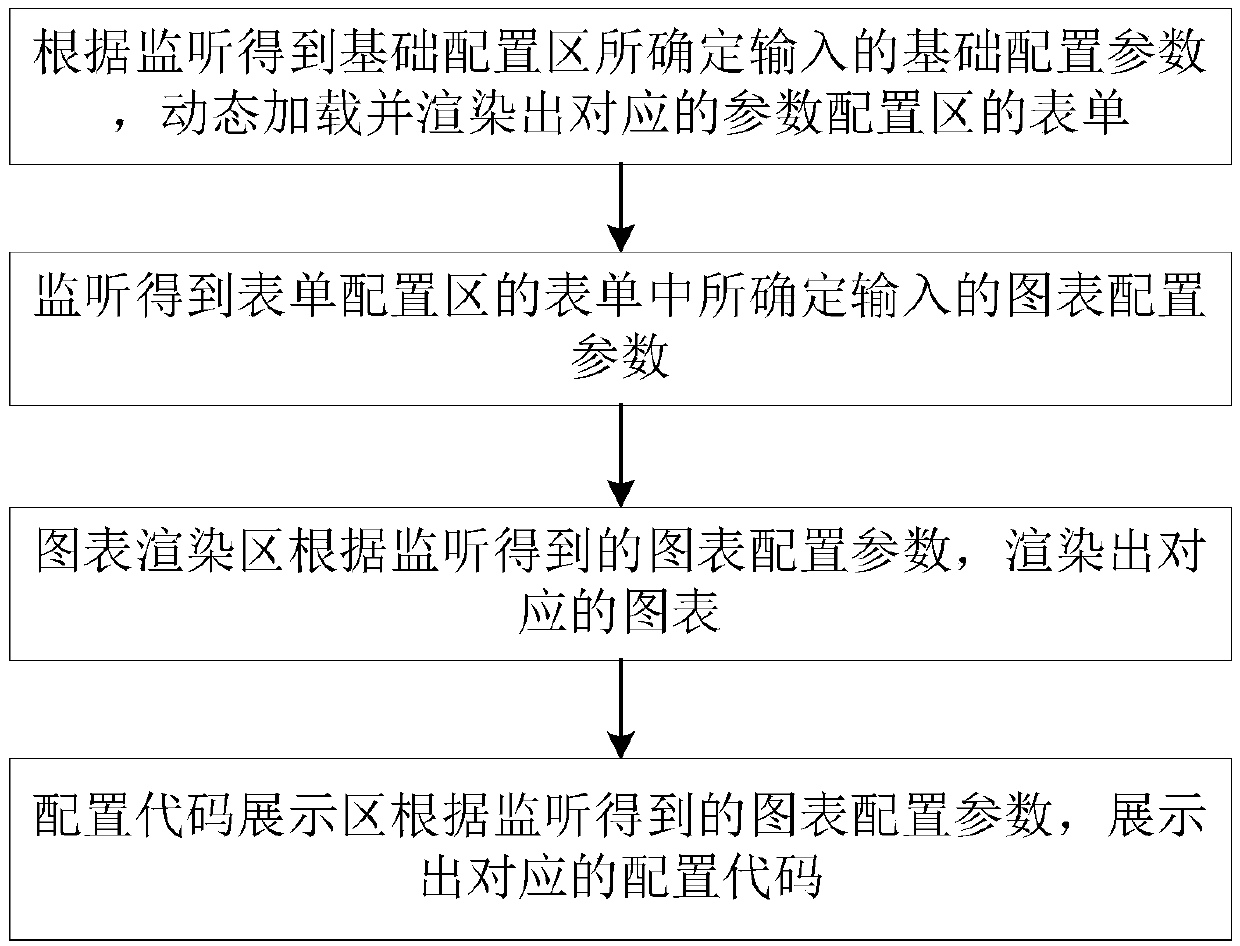
[0061] Such as figure 1 As shown, a method for visually configuring and generating graphs, the method includes the following steps:

[0062] The operation behavior listener monitors the input basic configuration parameters determined in the form of the basic configuration area, dynamically loads and renders the corresponding form of the parameter configuration area according to the basic configuration parameters obtained through monitoring, and configures the parameter verification unit to configure the parameters Fill in the form in the area, and monitor and verify the configuration information entered in the form in the parameter configuration area;

[0063] Monitor the chart configuration parameters determined to be input in the form in the form configuration area, and when all the forms in the parameter configuration area are checked and passed, then monitor the chart configuration parameters determined to be input in the form in the form configuration area; wherein, the f...

Embodiment 3

[0078] The present invention is described in detail in conjunction with the following preferred embodiments.

[0079] In order to reduce the threshold for using various third-party chart tool libraries, the purpose of the present invention is to provide a WYSIWYG chart visualization dynamic configuration generation scheme suitable for personnel without front-end development foundation. The corresponding program products can be Preferably it is a chart editing tool.

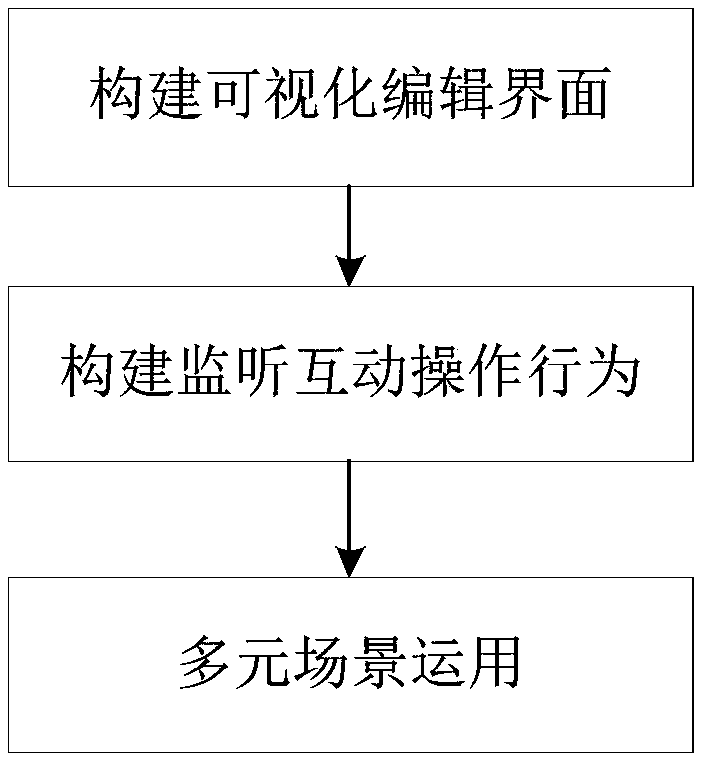
[0080] Such as figure 2 As shown, the present invention is a scheme for visual dynamic configuration and generation of charts, and its specific implementation steps are as follows.

[0081] Step 1: Build a visual editing interface.

[0082] The front-end chart tool implemented by the present invention can dynamically generate corresponding configuration items according to the user's form operation, and then guide the user to select the corresponding configuration parameters according to the prompts, so that the...


PUM


Abstract

The invention discloses a system and method for visually and dynamically configuring and generating diagrams. The system comprises a visual edition interface, an operation behavior monitor and a configuration parameter verification unit, wherein the visual edition interface is provided with a form configuration area, a diagram rendering area and a code display area. The method comprises the following steps of: loading and rendering a corresponding parameter configuration area according to basic configuration parameters input by a basic configuration area; monitoring diagram configuration parameters determined and input in a form in the form configuration area; rendering a corresponding diagram by the diagram rendering area according to the monitored diagram configuration parameters; and generating and displaying a corresponding configuration code by the configuration code display area according to the monitored diagram configuration parameters. The system and method are convenient andrapid to operate, is suitable for being used by front end-free development basic personnel, and is capable of reducing the threshold of front end diagram configuration generation operations and extending function points of visual front end configuration tools. The system and method for visually and dynamically configuring and generating diagrams can be widely applied in the field of front end design.

Description

technical field [0001] The invention relates to chart processing technology, in particular to a system and method for generating charts through visual dynamic configuration. Background technique [0002] Explanation of technical terms: [0003] Chart: Chart generally refers to the graphic structure displayed on the screen, which can visually display the attributes of statistical information (time, quantity, etc.), and plays a key role in knowledge mining and intuitive and vivid experience of information. It is a means of "visualizing" attribute data intuitively and vividly. [0004] Form: Elements in HTML, including different types of input elements, check boxes, radio buttons, submit buttons, and more. [0005] In recent years, with the development of front-end data and people's emphasis on big data, various big data chart display tools have increasingly appeared in the vision of developers, such as Baidu's echarts, HIGHSOFT's highcharts, InfoSoft Global Excellent front-...

Claims


Application Information

Patent Timeline
IPC IPC(8): G06F3/0484G06F8/34G06F8/38G06T11/20
CPCG06F3/04845G06F3/04847G06F8/34G06F8/38G06T11/206
Inventor 孔祥明陈洁林悦洁
Owner 广东广业开元科技有限公司
Why Eureka
Try Eureka