Electronic chart displaying method based on tile technology

A technology of electronic chart and display method, which is applied in image coding, image data processing, electronic digital data processing, etc., can solve the problems of increasing server load and reducing the efficiency of system rendering maps, etc., to achieve improved efficiency, fast map output, and responsiveness fast effect

Inactive Publication Date: 2018-05-18
CHONGQING UNIV OF POSTS & TELECOMM
View PDF11 Cites 14 Cited by
  • Summary
  • Abstract
  • Description
  • Claims
  • Application Information

AI Technical Summary

Problems solved by technology

This rendering method inevitably increases the load on the server, and at the same time reduces the efficiency of the system rendering maps

Method used


Image

  • Electronic chart displaying method based on tile technology
  • Electronic chart displaying method based on tile technology
  • Electronic chart displaying method based on tile technology

Examples


Embodiment Construction

[0041] specific implementation plan

[0042]Further describe the technical scheme of the present invention in detail below in conjunction with accompanying drawing:

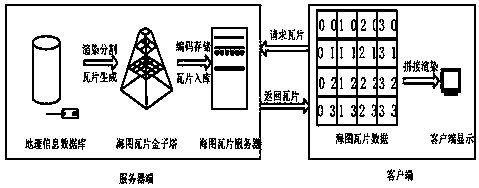
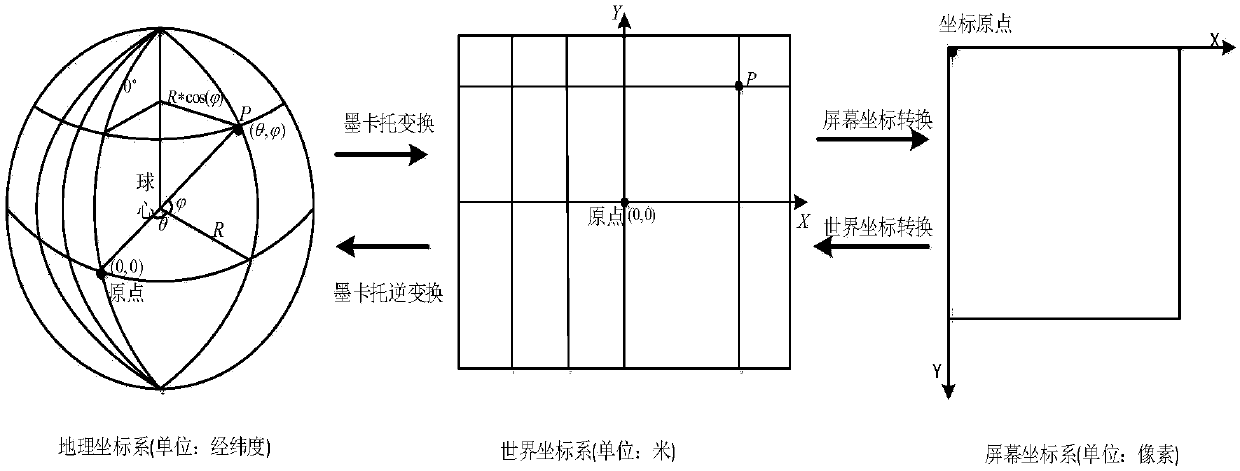
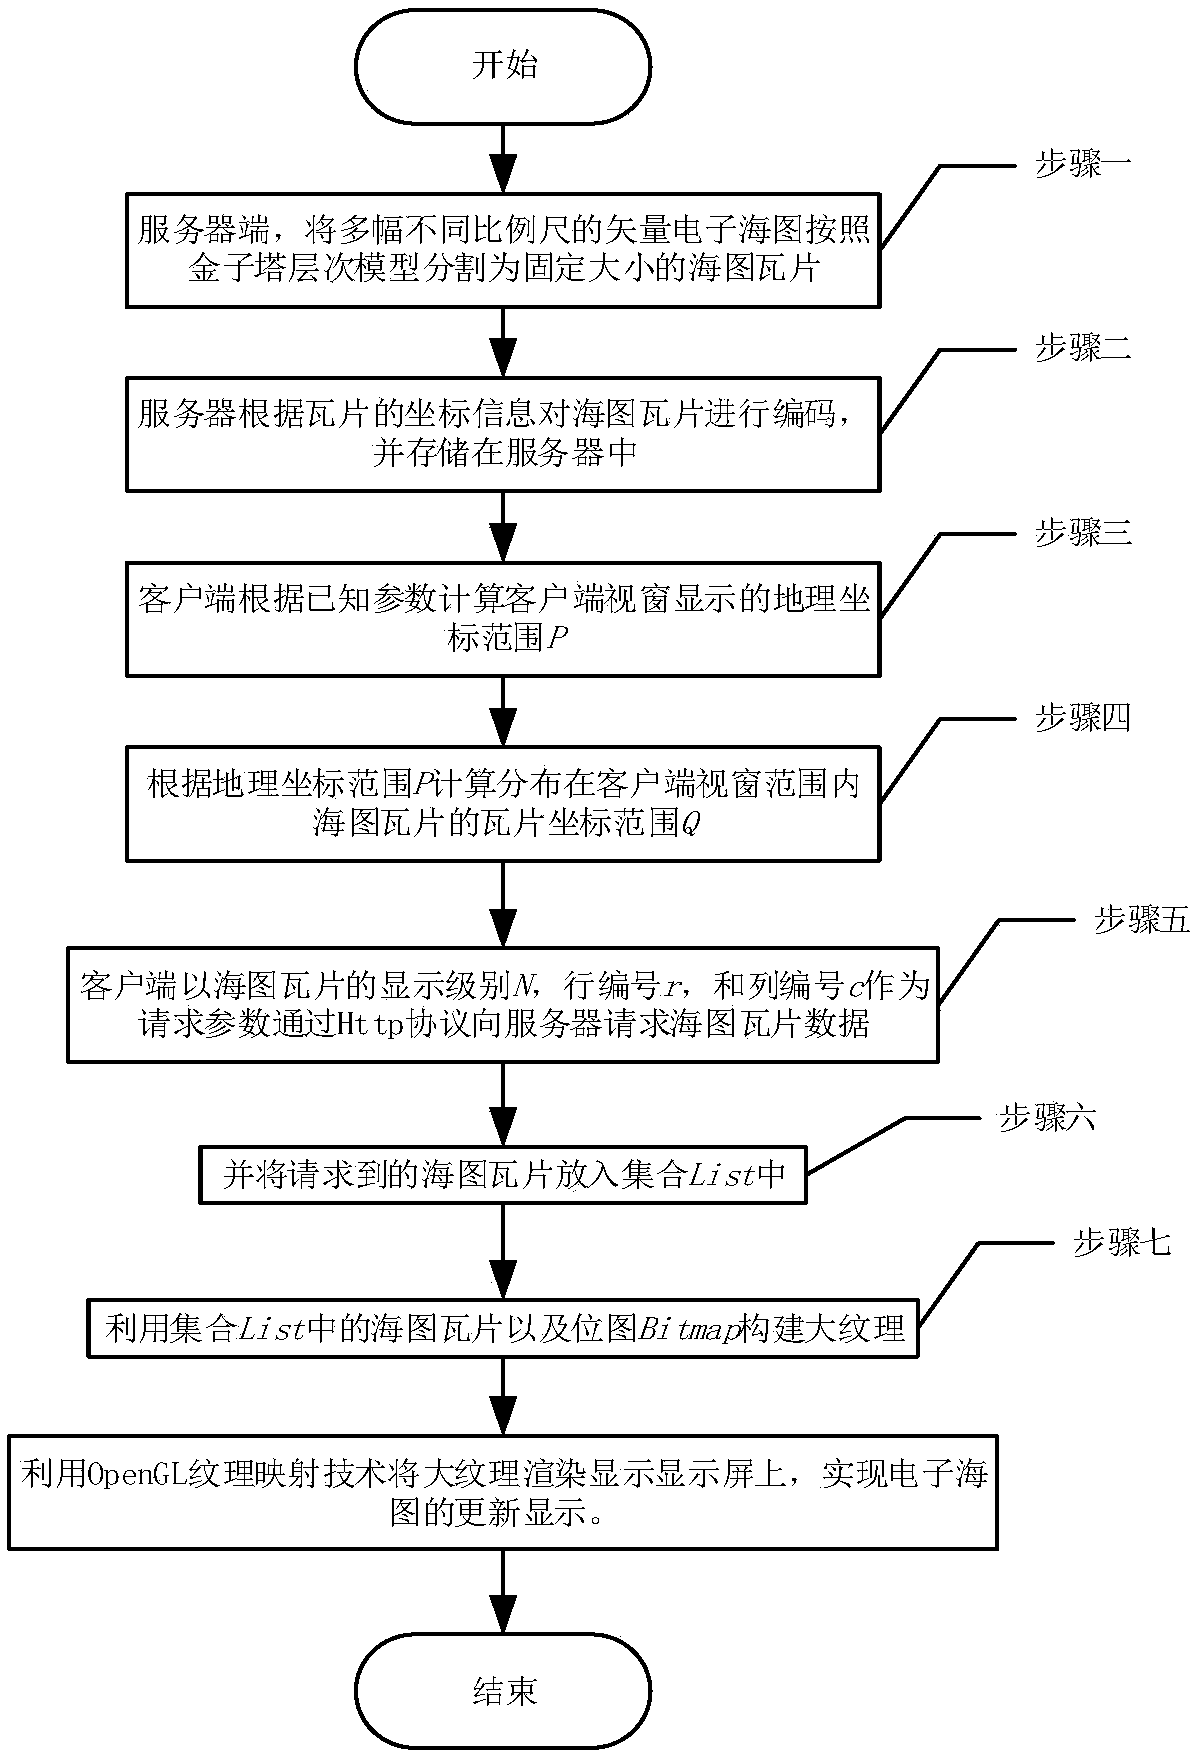
[0043] Refer to the attached figure 2 , the working principle of the electronic chart system based on tile technology is as follows: the server divides the electronic chart of different scales into chart tiles according to the pyramid hierarchy model, and encodes and stores the chart tiles. Then the client determines the range of geographic coordinates displayed by the client window according to the given geographic coordinates of the center point of the window, the display scale and the size of the window. Then calculate the number range of the tiles distributed in the window range. Finally, the client requests the sea chart tile data from the server according to the number of the tile, and splices and renders the obtained map tiles on the screen. As attached to the manual image 3 As shown, the flowchart o...


PUM


Abstract

The invention discloses an electronic chart displaying method based on a tile technology. The method comprises the steps that firstly, a server segments multiple electronic charts which have differentmeasuring scales into square lattice pictures with the fixed size according to a pyramid hierarchical model, and these lattice pictures are chart tiles; then, the server codes the map tiles accordingto the hierarchy and the coordinate information of a pyramid where the tiles are located, and stores the tiles according to coding information of the chart tiles; then, a client side determines a geographical coordinate range displayed by a view window according to a coordinate conversion formula, converts the geographical coordinate range into a serial number range of the chart tiles, and requests the chart tiles from the server according to the serial numbers of the tiles; finally, the client side splices the obtained electronic chart tiles into large textures, and displays the large textures on a screen in a rendering mode through an OpenGL texture mapping technology. By means of the electronic chart displaying method based on the tile technology, the displaying efficiency of the electronic charts is improved, and the application scene of the electronic chart is expanded.

Description

technical field [0001] The invention relates to an electronic chart display method based on tile technology. Background technique [0002] WebGIS (Web Map Information System) is the product of Internet (Internet) technology applied to GIS (Geographic Information System). Early WebGIS, such as WMS (Web Map Server network map service) using B / S (Browser / Server) architecture, its map rendering principle is that the server renders and draws pictures in real time, and then loads them into the browser for display. This rendering method inevitably increases the load on the server, and at the same time reduces the efficiency of the system for rendering maps. Google (Google) proposes that the tile map technology is stored on the server side in the form of pre-slicing (map tiles), and the client directly requests the server to access the map tiles, which effectively solves the problem of slow and inefficient traditional WebGIS map output. Tiling has become the most mainstream GIS fo...

Claims


Application Information

Patent Timeline
Patent Type & Authority Applications(China)
IPC IPC(8): G06F17/30G06T9/00G06T11/00
CPCG06T9/00G06T11/001G06F16/29
Inventor 周牧余斌田增山陈纳新吕文俊
Owner CHONGQING UNIV OF POSTS & TELECOMM
Why Eureka
Try Eureka