Eureka AIR delivers breakthrough ideas for toughest innovation challenges, trusted by R&D personnel around the world.

Power grid abnormal state detecting method based on maximum feature value of sample covariance matrix

A technology of covariance matrix and maximum eigenvalue, applied in the direction of measuring electricity, measuring devices, measuring electrical variables, etc., can solve problems such as power grid failure, and achieve the effect of effective detection, good anti-noise performance, and less time-consuming calculation

Inactive Publication Date: 2018-06-22
GUIZHOU UNIV
View PDF5 Cites 27 Cited by
  • Summary
  • Abstract
  • Description
  • Claims
  • Application Information

AI Technical Summary

Problems solved by technology

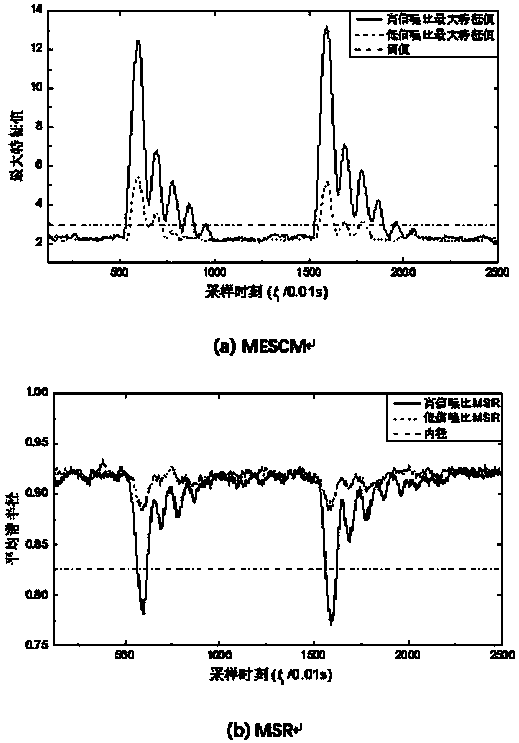
[0006] The purpose of the present invention is to overcome the above shortcomings, and propose a method that can solve the potential failure problem of the traditional average spectral radius method in the abnormal state of the power grid in the low signal-to-noise ratio scene, and at the same time save the traditional method based on random matrix theory by reducing the calculation process. The calculation time of the power grid abnormal state detection method is time-consuming, and the calculation efficiency is significantly improved. The power grid abnormal state detection method based on the largest eigenvalue of the sample covariance matrix

Method used


Image

  • Power grid abnormal state detecting method based on maximum feature value of sample covariance matrix
  • Power grid abnormal state detecting method based on maximum feature value of sample covariance matrix
  • Power grid abnormal state detecting method based on maximum feature value of sample covariance matrix

Examples


Embodiment Construction

[0039] The specific implementation of the present invention will be described in detail below in conjunction with the drawings and examples, but the present invention is not limited by the specific examples.

[0040] Considering the influence of channel noise in the transmission process, the abnormal state detection model is defined as shown in formula (1).

[0041] x s =X P +m×η (1)

[0042] where X P Be the PMU signal matrix, η is the noise matrix, and the present invention all adopts Gaussian noise, and m is the noise amplitude. The noise level will affect the effect of grid abnormal state detection. To this end, the signal-to-noise ratio (Signal-to-NoiseRatio, SNR) of the data source matrix is ​​defined as shown in formula (2).

[0043]

[0044] where Tr(·) is the trace of the matrix.

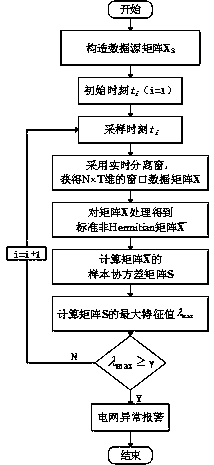
[0045] According to the steps of the present invention, such as figure 1 as shown,

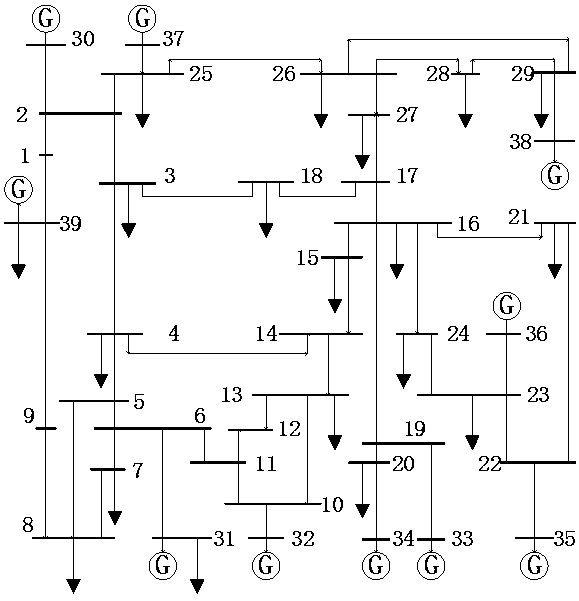
[0046] Step 1: Data Source Matrix X s structure. Assuming that a power grid has N≥1 receivi...


PUM


Abstract

The invention discloses a power grid abnormal state detecting method based on a maximum feature value of a sample covariance matrix. The power grid abnormal state detecting method based on the maximumfeature value of the sample covariance matrix comprises the following steps: step 1, constructing a data source matrix Xs; step 2, acquiring a sliding window matrix X; step 3, standardizing the sliding window matrix X; step 4, acquiring a sample covariance matrix S; step 5, solving a maximum feature value as shown in specification of the sample covariance matrix; step 6, power grid state abnormalout-of-limit judgment: judging whether the maximum feature value as shown in specification is greater than a threshold value as shown in specification, if the maximum feature value is greater than the threshold value, determining that the state of a power grid is abnormal, and giving an alarm, and if the maximum feature value is not greater than the threshold value, determining that the abnormalstate does not exist at present, and returning to step 2 to continue carrying out a state abnormity detecting flow. The potential invalidation problem caused when a traditional mean spectral radius method detects the abnormal state of the power grid in a low signal-to-noise ratio scene is solved, meanwhile, calculation consumed time of a traditional method for detecting the abnormal state of the power grid on the basis of a random matrix theory is saved by simplifying a calculating link, and the calculating efficiency is improved remarkably.

Description

technical field [0001] The invention belongs to the technical field of power grid abnormality detection, and in particular relates to a power grid abnormal state detection method based on the maximum eigenvalue of sample covariance matrix (Maximum Eigenvalue of Sample Covariance Matrix, MESCM). Background technique [0002] Wide Area Measurement System (WAMS) based on Synchronized Phasor Measurement Units (PMU) is becoming more and more mature, and the amount of data generated is increasing exponentially. Introduce big data technology into traditional power system analysis, carry out in-depth research on mining, extraction, analysis and fusion of data-driven operating status data, and realize "big data thinking" analysis and evaluation of power grid operating status. For my country's "Internet +" The development of smart grid has important theoretical significance. [0003] Big data is essentially a methodology or epistemology, which believes that data is an internal mechani...

Claims


Application Information

Patent Timeline
Patent Type & Authority Applications(China)
IPC IPC(8): G01R31/08
CPCG01R31/086G01R31/088Y02E40/70Y02E60/00Y04S10/00Y04S10/22
Inventor 韩松周忠强
Owner GUIZHOU UNIV
Why Eureka
Eureka Blog
Learn More