Spiral figure visual curve binding method based on time interval
A time interval and spiral graph technology, applied in the field of data visualization, can solve problems such as visual clutter
- Summary
- Abstract
- Description
- Claims
- Application Information
AI Technical Summary
Problems solved by technology
Method used
Image
Examples
Embodiment Construction
[0051] The symbols used in this embodiment are shown in the table below:
[0052] Table 1 Symbol Description
[0053]
[0054] Continuation
[0055]
[0056] The specific implementation steps are as follows:
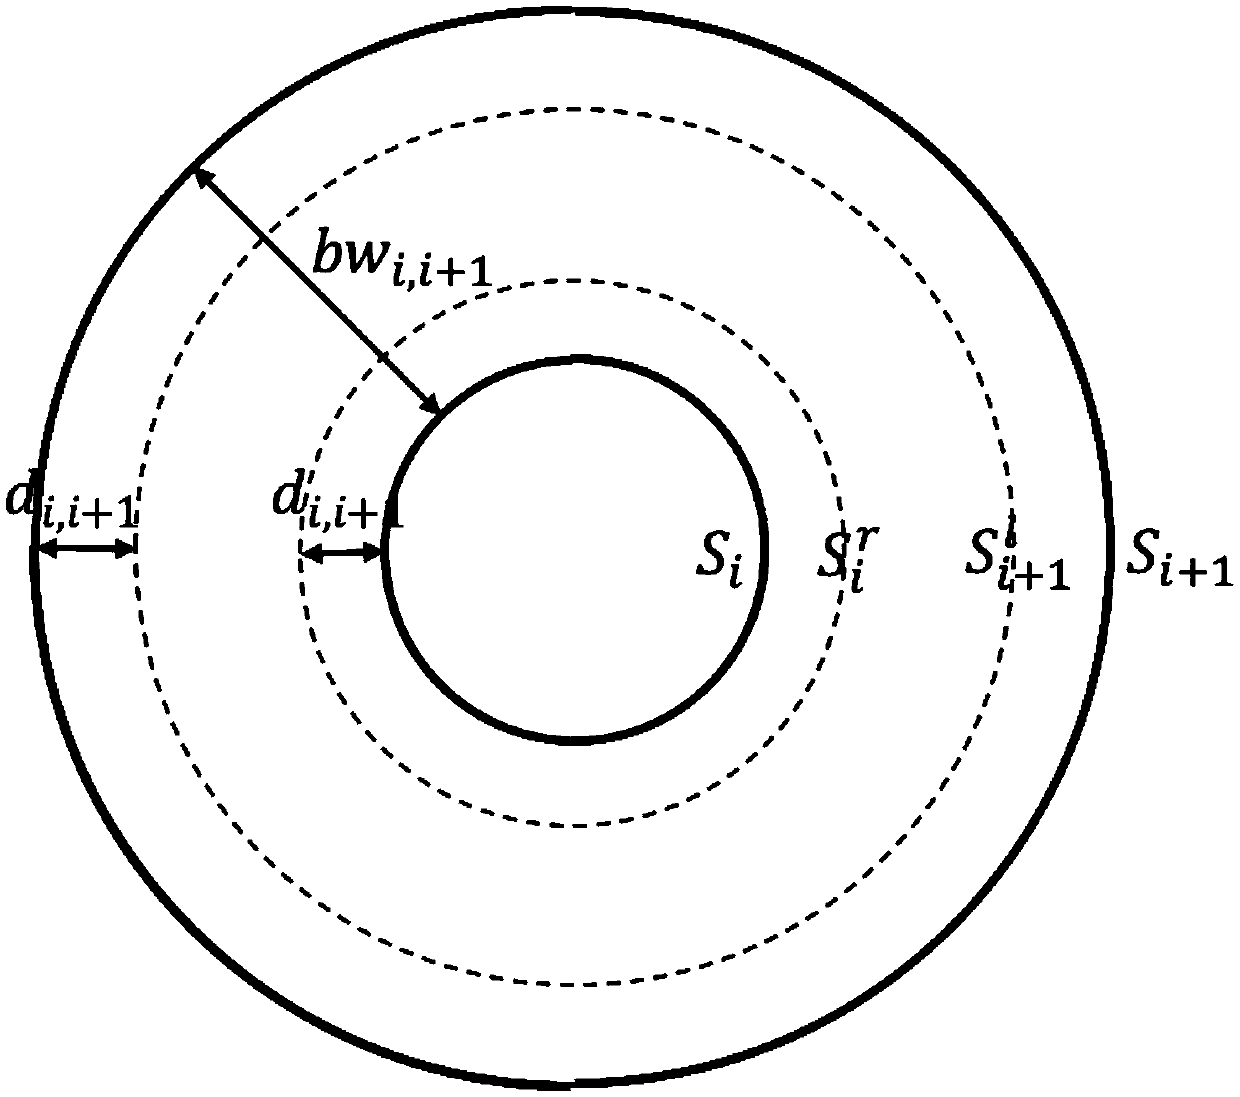
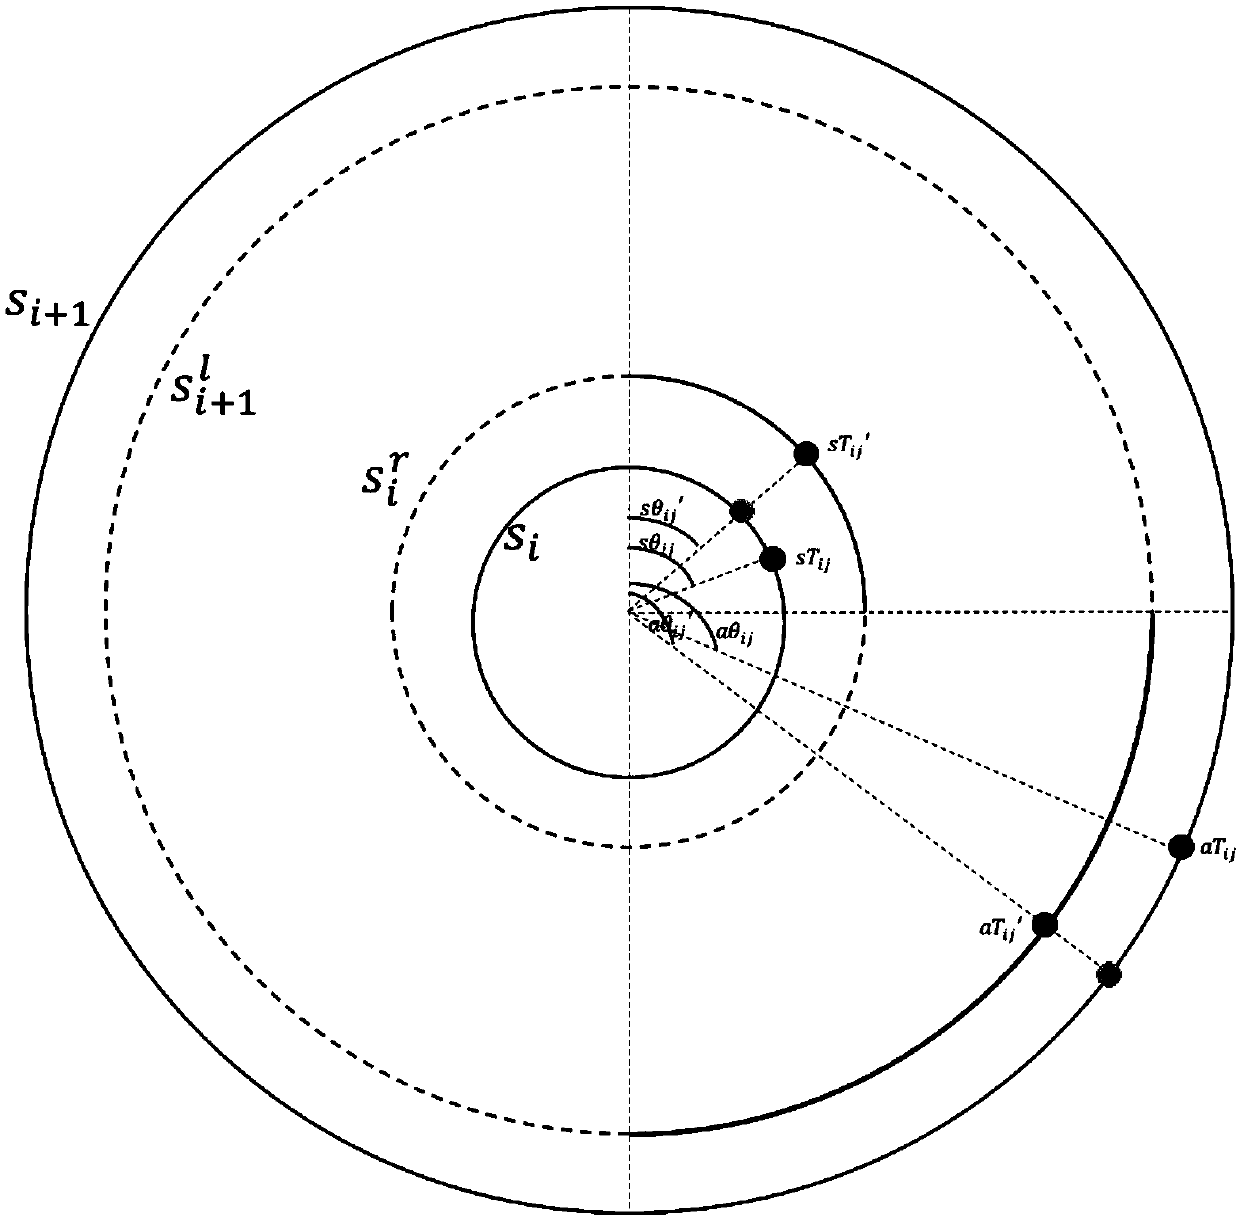
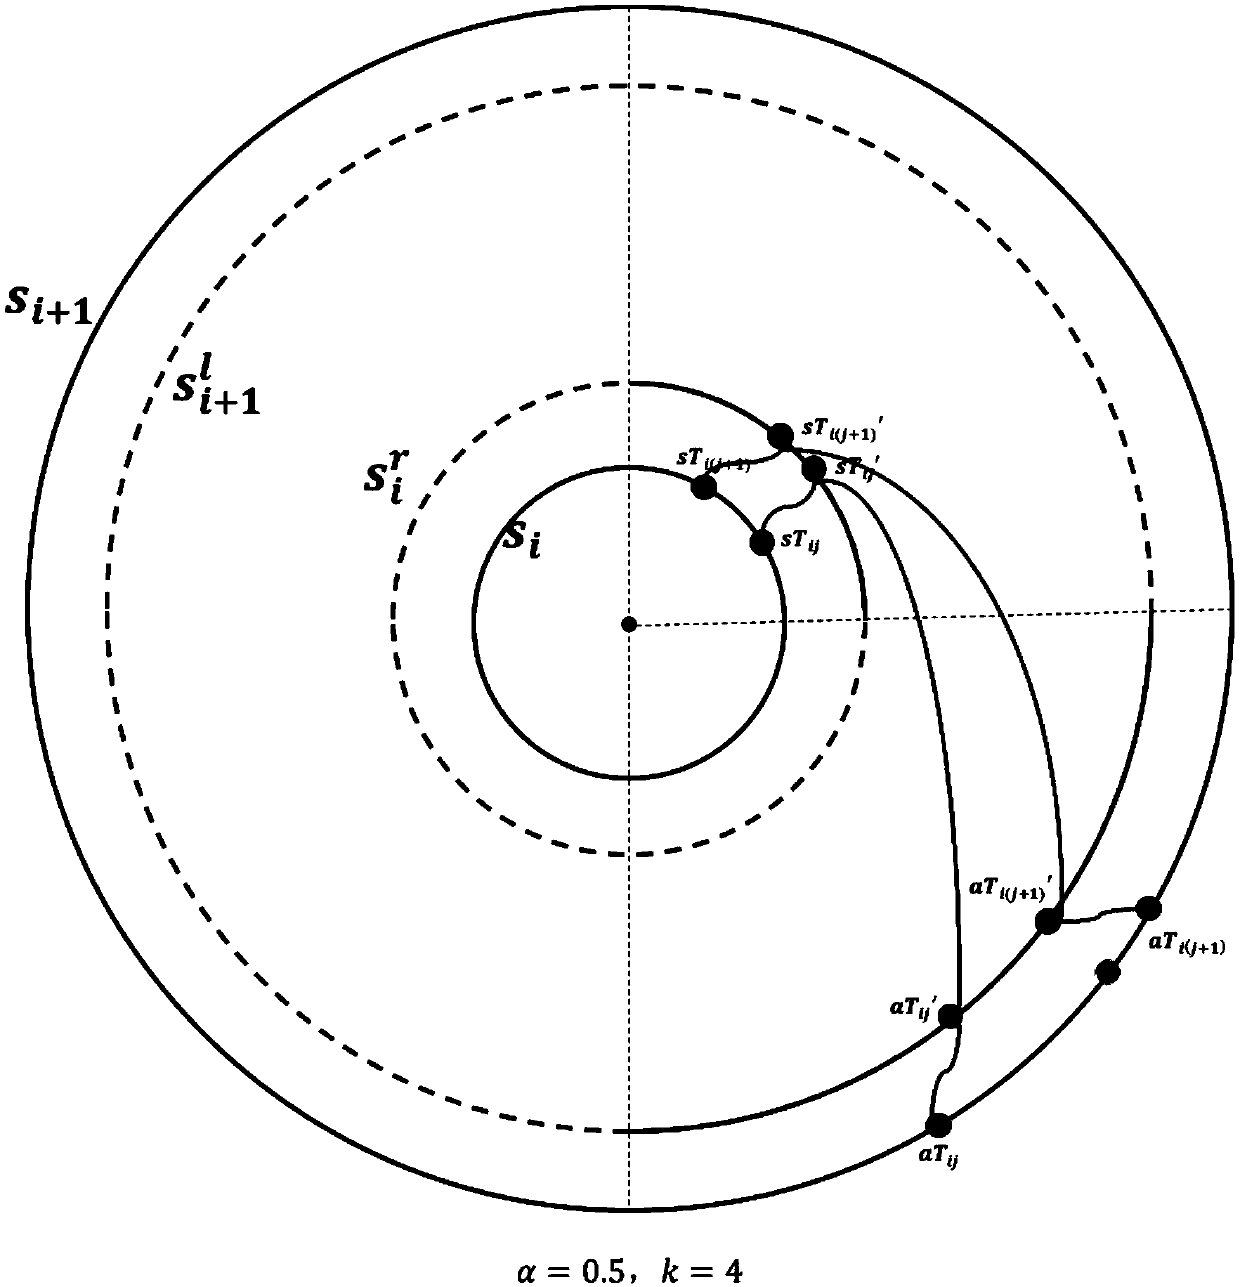
[0057] Step 1: Enter a periodical time series dataset. Dataset D = {d 1 , d 2 ,...,d n}, where n is the amount of data; d i =(sd i ,sd i+1 , lines i )(1≤ii and sd i+1 Respectively represent the descriptive data of state i and i+1, such as state name; lines i Represents the path data from state i to state i+1; lines i = here f i Indicates the number of paths from state i to state i+1; l i,j Including two time attributes startTime and arriveTime, wherein startTime represents the start time of transition from state i to state i+1, and arriveTime represents the end time of transition from state i to state i+1; l i,j It also includes a time-consuming attribute timeValue, and timeValue represents the time it takes to transition from state i to state i+1. ...
PUM
 Abstract
Description
Claims
Application Information
 - R&D
- Intellectual Property
- Life Sciences
- Materials
- Tech Scout
- Unparalleled Data Quality
- Higher Quality Content
- 60% Fewer Hallucinations
Browse by: Latest US Patents, China's latest patents, Technical Efficacy Thesaurus, Application Domain, Technology Topic, Popular Technical Reports.
© 2025 PatSnap. All rights reserved.Legal|Privacy policy|Modern Slavery Act Transparency Statement|Sitemap|About US| Contact US: help@patsnap.com


