A Multi-position Dynamic Spectral Difference Extraction Method
What is AI technical title?
AI technical title is built by Patsnap AI team. It summarizes the technical point description of the patent document.
A dynamic spectrum, multi-position technology, applied in the use of spectrum diagnosis, medical science, diagnosis, etc., to achieve the effect of suppressing random errors
Inactive Publication Date: 2021-04-20
TIANJIN UNIV
View PDF9 Cites 0 Cited by
Summary
Abstract
Description
Claims
Application Information
AI Technical Summary
This helps you quickly interpret patents by identifying the three key elements:
Problems solved by technology
Method used
Benefits of technology
Problems solved by technology
So far, there is no extraction method that can effectively suppress the nonlinear effects of blood scattering
Method used
Image
Click on the blue label to locate the original text in one second.
Reading with bidirectional positioning of images and text.
Examples
Embodiment 1
[0036] A multi-position dynamic spectrum extraction method, see Figure 1-Figure 6 , the extraction method includes the following steps:
[0037] 101: Divide a period of the PPG signal into four areas, which are two areas in the upper half and two areas in the lower half;
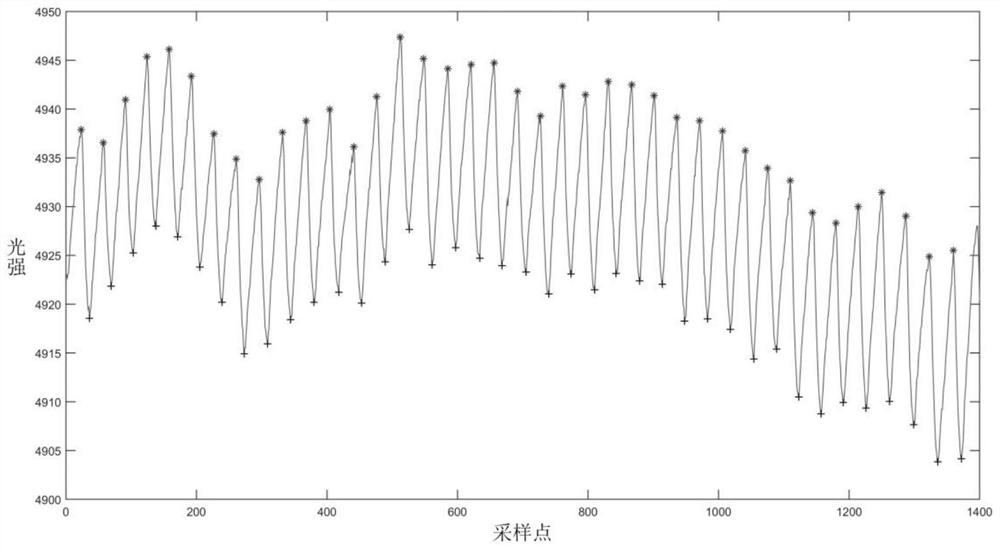
[0038] Among them, see image 3 , a periodic PPG signal, the PPG signals at all wavelengths in a sample are superimposed as the PPG template signal, and the time difference between two adjacent peaks of the template PPG signal is taken as a cycle.
[0039] see Figure 4 , with the position of the mean value and the minimum value of a pulse wave cycle as the boundary, a cycle of PPG signal is divided into four areas, namely area I, area II, area III, and area IV.
[0040] 102: Perform dynamic spectral extraction independently on the two regions of the upper half and the two regions of the lower half, and perform dynamic spectral extraction on the overall spectrum, and finally superimpose and average these...
Embodiment 2
[0047] Combine below Figure 2-Figure 6 , and the specific calculation formula further introduces the scheme in embodiment 1, see the following description for details:
[0048] 201: Establish a PPG template;
[0049] That is, the logarithmic PPG signals at all wavelengths in a sample are superimposed as the PPG template signal of the sample. By superimposing the PPG signals, part of the high-frequency noise is suppressed, which is conducive to the establishment of the subsequent period and the search for peak and valley values. , PPG template such as image 3 shown.
[0050] 202: Find the peak-valley value of the PPG template, and use the interval between two adjacent peaks of the PPG template as a pulse period;
[0051] 203: Divide the PPG signal of one pulse cycle into 4 regions;
[0052] That is, take the average value in one period as the midline, divide the PPG signal of this period into the upper half and the lower half, and then use the respective average values ...
Embodiment 3
[0071] Below in conjunction with concrete experiment, the scheme in embodiment 1 and 2 is carried out feasibility verification, see the following description for details:
[0072] pass Figure 7 The experimental results show that the multi-position spectrum provided by the embodiment of the present invention can extract more scattering information, which meets various needs in practical applications.
PUM
Abstract
The invention discloses a multi-position dynamic spectrum extraction method. The method comprises the following steps: taking the positions of the mean value and the minimum value of a pulse wave cycle as boundaries, and dividing a cycle of PPG signals into four regions, which are respectively the above The two areas in the first half and the two areas in the lower half; according to the principle that the number of data points in the dynamic spectrum of each area can be divisible by 2, the two areas in the upper half and the two areas in the lower half are The number of data points is divided; after the division, the sliding difference method is used to extract the dynamic spectrum independently for each area; and the dynamic spectrum is extracted for the overall spectrum, and finally these spectra are superimposed and averaged to obtain the whole; Sliding difference is performed on the logarithmic PPG signal, and the difference obtained is used to form a sub-dynamic spectrum. The invention can extract situations representing different nonlinear information, utilize the spectral information carried by the nonlinear, suppress the nonlinear influence brought by blood scattering, and improve the precision of dynamic spectrum non-invasive blood component analysis.
Description
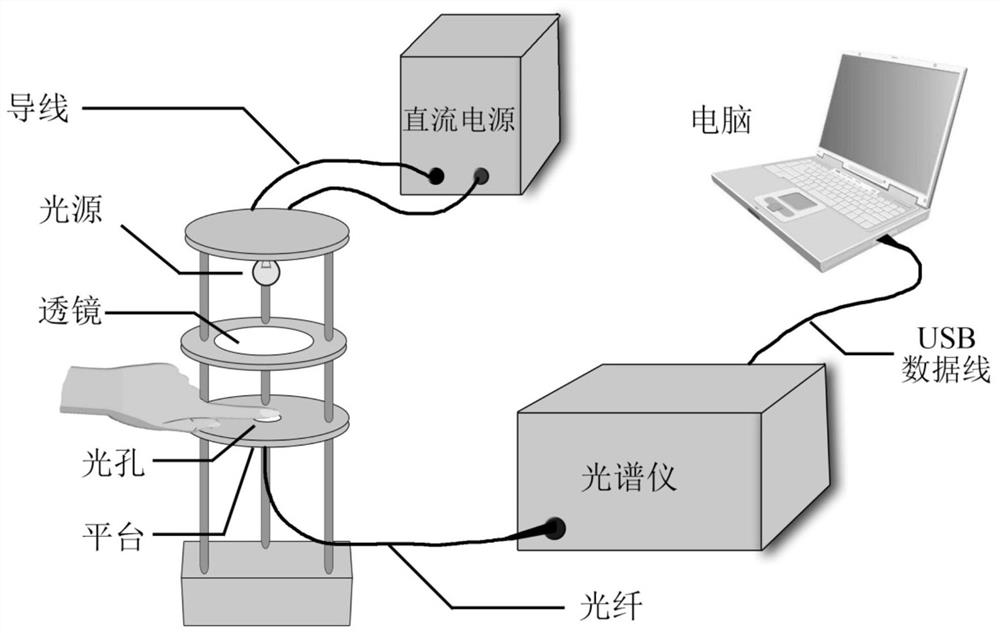
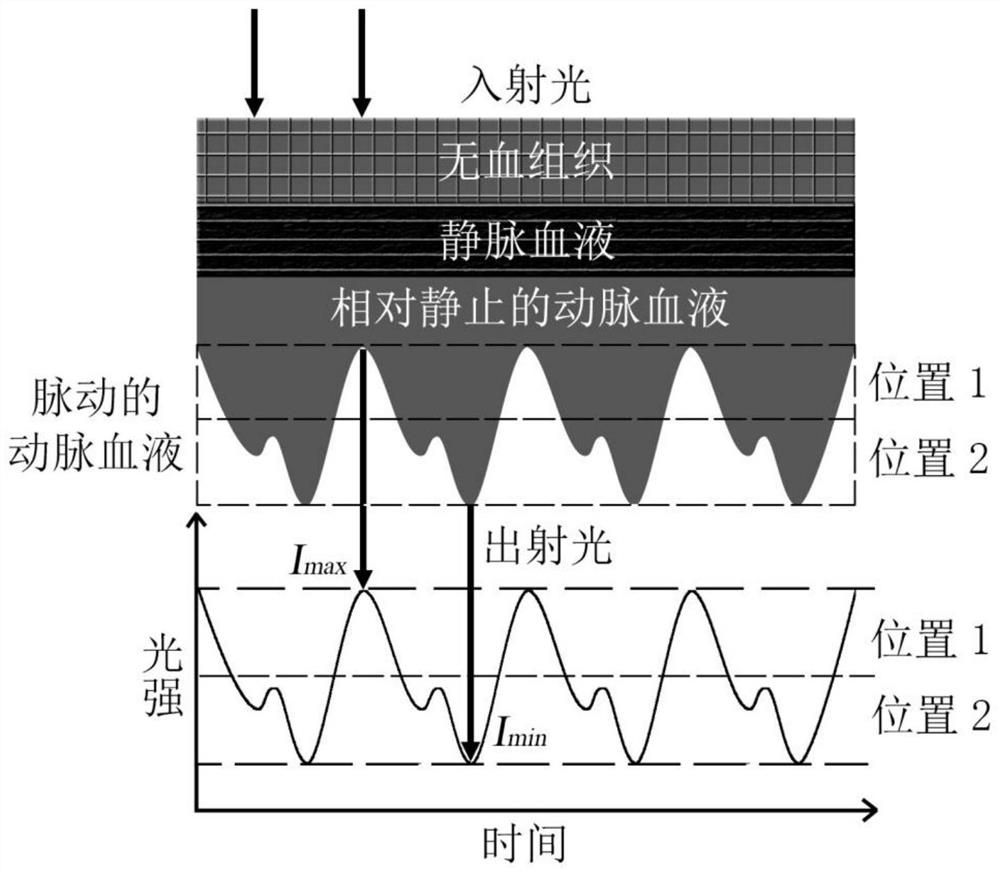
technical field [0001] The invention relates to the field of dynamic spectrum extraction, in particular to a multi-position dynamic spectrum difference extraction method. Background technique [0002] Dynamic spectroscopy is a non-invasive measurement method for detecting blood components. By extracting the absorbance of pulsating blood at multiple wavelengths, it can greatly reduce the influence of individual differences and measurement environments on non-invasive detection in the human body. In the previous dynamic spectrum extraction, dynamic spectrum is constantly developing towards higher signal-to-noise ratio and higher data utilization. [0003] In the peak-to-peak method of dynamic spectroscopy [ 1 ], only use 2 points of the peak-valley value of each PPG (photoplethysmography) pulsation cycle to extract the dynamic spectrum, because the data utilization rate is low, this method cannot obtain higher signal-to-noise ratio; In the Chinese invention patent application...
Claims
Application Information
Patent Timeline
Application Date:The date an application was filed.
Publication Date:The date a patent or application was officially published.
First Publication Date:The earliest publication date of a patent with the same application number.
Issue Date:Publication date of the patent grant document.
PCT Entry Date:The Entry date of PCT National Phase.
Estimated Expiry Date:The statutory expiry date of a patent right according to the Patent Law, and it is the longest term of protection that the patent right can achieve without the termination of the patent right due to other reasons(Term extension factor has been taken into account ).
Invalid Date:Actual expiry date is based on effective date or publication date of legal transaction data of invalid patent.

