A Two-position Dynamic Spectral Difference Extraction Method

A dynamic spectrum, dual-position technology, applied in the use of spectrum diagnosis, medical science, diagnosis, etc., to achieve the effect of ensuring the signal-to-noise ratio, suppressing random errors, and suppressing influences

Active Publication Date: 2021-05-07
TIANJIN UNIV
View PDF9 Cites 0 Cited by
  • Summary
  • Abstract
  • Description
  • Claims
  • Application Information

AI Technical Summary

Problems solved by technology

So far, there is no extraction method that can effectively suppress the nonlinear effects of blood scattering

Method used


Image

  • A Two-position Dynamic Spectral Difference Extraction Method
  • A Two-position Dynamic Spectral Difference Extraction Method
  • A Two-position Dynamic Spectral Difference Extraction Method

Examples


Embodiment 1

[0033] A dual-position dynamic spectrum extraction method, see Figure 1-Figure 3 , the extraction method includes the following steps:

[0034] 101: Divide a period of the PPG signal into four areas, which are two areas in the upper half and two areas in the lower half;

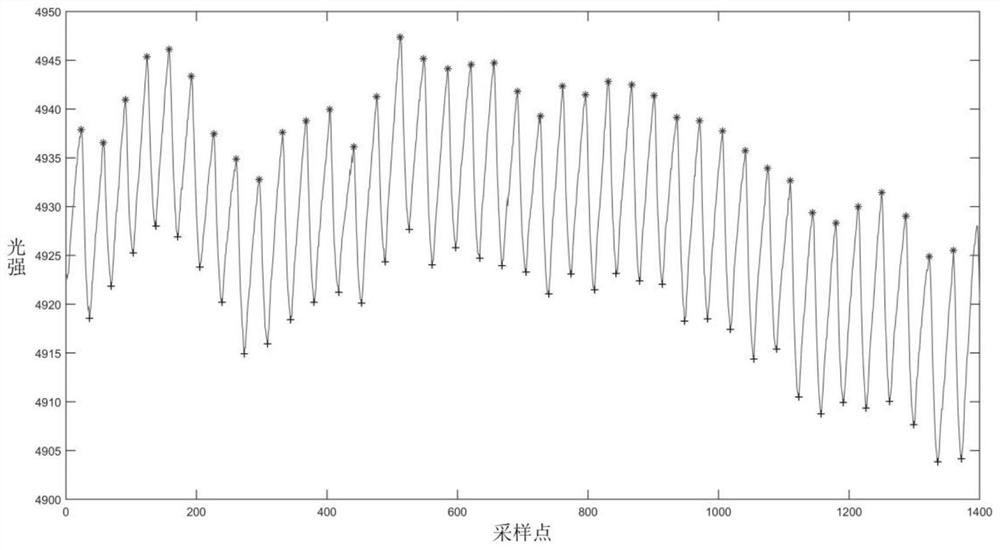
[0035] Among them, see image 3 , a periodic PPG signal, the PPG signals at all wavelengths in a sample are superimposed as the PPG template signal, and the time difference between two adjacent peaks of the template PPG signal is taken as a cycle.

[0036] see Figure 4 , with the position of the mean value and the minimum value of a pulse wave cycle as the boundary, a cycle of PPG signal is divided into four areas, namely area I, area II, area III, and area IV.

[0037] 102: Independently perform dynamic spectrum extraction on the two regions in the upper half and the two regions in the lower half;

[0038] Among them, see Figure 4 and Figure 5 , the extraction of the dynamic spectrum is as follows:...

Embodiment 2

[0043] Combine below Figure 2-Figure 6 , and the specific calculation formula further introduces the scheme in embodiment 1, see the following description for details:

[0044] 201: Establish a PPG template;

[0045] That is, the logarithmic PPG signals at all wavelengths in a sample are superimposed as the PPG template signal of the sample. By superimposing the PPG signals, part of the high-frequency noise is suppressed, which is conducive to the establishment of the subsequent period and the search for peak and valley values. , PPG template such as image 3 shown.

[0046] 202: Find the peak-valley value of the PPG template, and use the interval between two adjacent peaks of the PPG template as a pulse period;

[0047] 203: Divide the PPG signal of one pulse cycle into 4 regions;

[0048] That is, take the average value in one period as the midline, divide the PPG signal of this period into the upper half and the lower half, and then use the respective average values ​​...

Embodiment 3

[0066] Below in conjunction with concrete experiment, the scheme in embodiment 1 and 2 is carried out feasibility verification, see the following description for details:

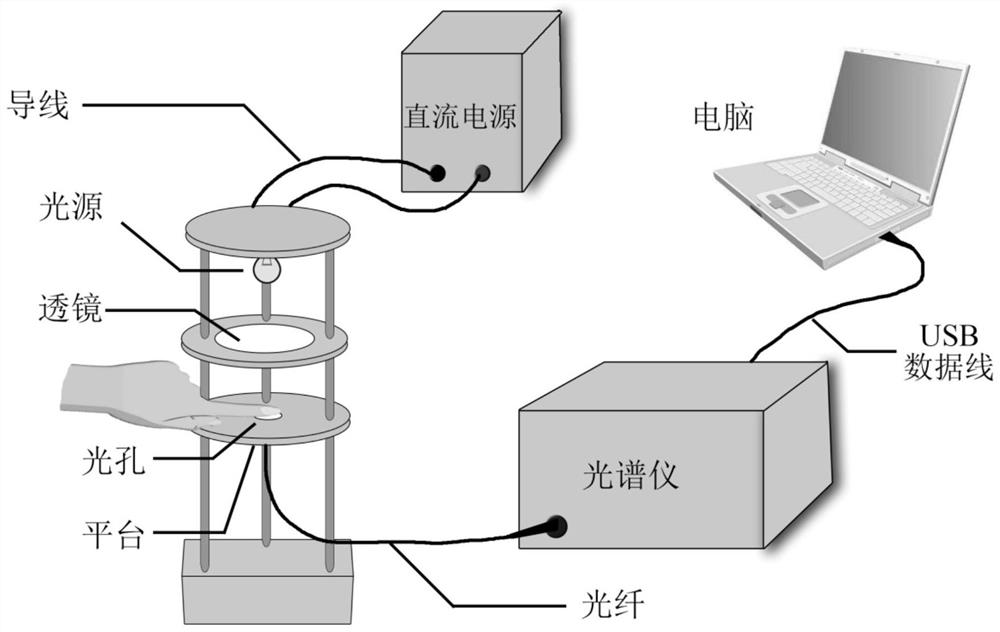
[0067] The experimental data acquisition device in the embodiment of the present invention is mainly made up of light source, programmable regulated power supply, spectrometer, optical fiber and computer, as figure 1 shown. The light source of this experiment is a bromine tungsten lamp, and the spectrometer is the AvaSpec-HS1024x58TEC spectrometer of Avantis, and the detection wavelength range is 200nm-1160nm.

[0068] In the process of data collection, the light source directly illuminates the finger, and the transmitted light of the finger is transmitted through the optical fiber into the spectrometer for collection. The spectrometer transmits the collected spectral data to the PC through USB for data storage and subsequent processing. The data of this experiment were collected from 231 persons who under...


PUM


Abstract

The invention discloses a dual-position dynamic spectrum extraction method. The method comprises the following steps: taking the positions of the mean value and the minimum value of a pulse wave cycle as boundaries, and dividing a cycle of PPG signals into four regions, which are respectively the upper The two areas in the first half and the two areas in the lower half; according to the principle that the number of data points in the dynamic spectrum of each area can be divisible by 2, the two areas in the upper half and the two areas in the lower half are Divide the number of data points; after the division, use the sliding difference method to extract the dynamic spectrum independently for each area; perform sliding difference on the collected logarithmic PPG signals at each wavelength, and use the obtained difference to form a sub-dynamic spectrum. The invention can extract situations representing different nonlinear information, utilize the spectral information carried by the nonlinear, suppress the nonlinear influence brought by blood scattering, and improve the precision of dynamic spectrum non-invasive blood component analysis.

Description

technical field [0001] The invention relates to the field of dynamic spectrum extraction, in particular to a dual-position dynamic spectrum difference extraction method. Background technique [0002] Dynamic spectroscopy is a non-invasive measurement method for detecting blood components. By extracting the absorbance of pulsating blood at multiple wavelengths, it can greatly reduce the influence of individual differences and measurement environments on non-invasive detection in the human body. In the previous dynamic spectrum extraction, dynamic spectrum is constantly developing towards higher signal-to-noise ratio and higher data utilization. [0003] In the peak-to-peak method of dynamic spectroscopy [1] , only use 2 points of the peak-valley value of each PPG (photoplethysmography) pulsation cycle to extract the dynamic spectrum. Due to the low data utilization rate, this method cannot obtain a higher signal-to-noise ratio; in the Chinese invention patent application CN1...

Claims


Application Information

Patent Timeline
Patent Type & Authority Patents(China)
IPC IPC(8): A61B5/0295
CPCA61B5/0075A61B5/0295
Inventor 林凌汤伟王玉宇李刚
Owner TIANJIN UNIV
Why Eureka
Try Eureka