Rubber material consistency monitoring method
A rubber material, consistent technology, applied in the material field, can solve the problems of lack of material test piece and actual parts material consistency, lack of parts consistency control, no verification standards, etc., to achieve short test cycle, effective transfer, sample small amount of effect
- Summary
- Abstract
- Description
- Claims
- Application Information
AI Technical Summary
Problems solved by technology
Method used
Image
Examples
Embodiment 1
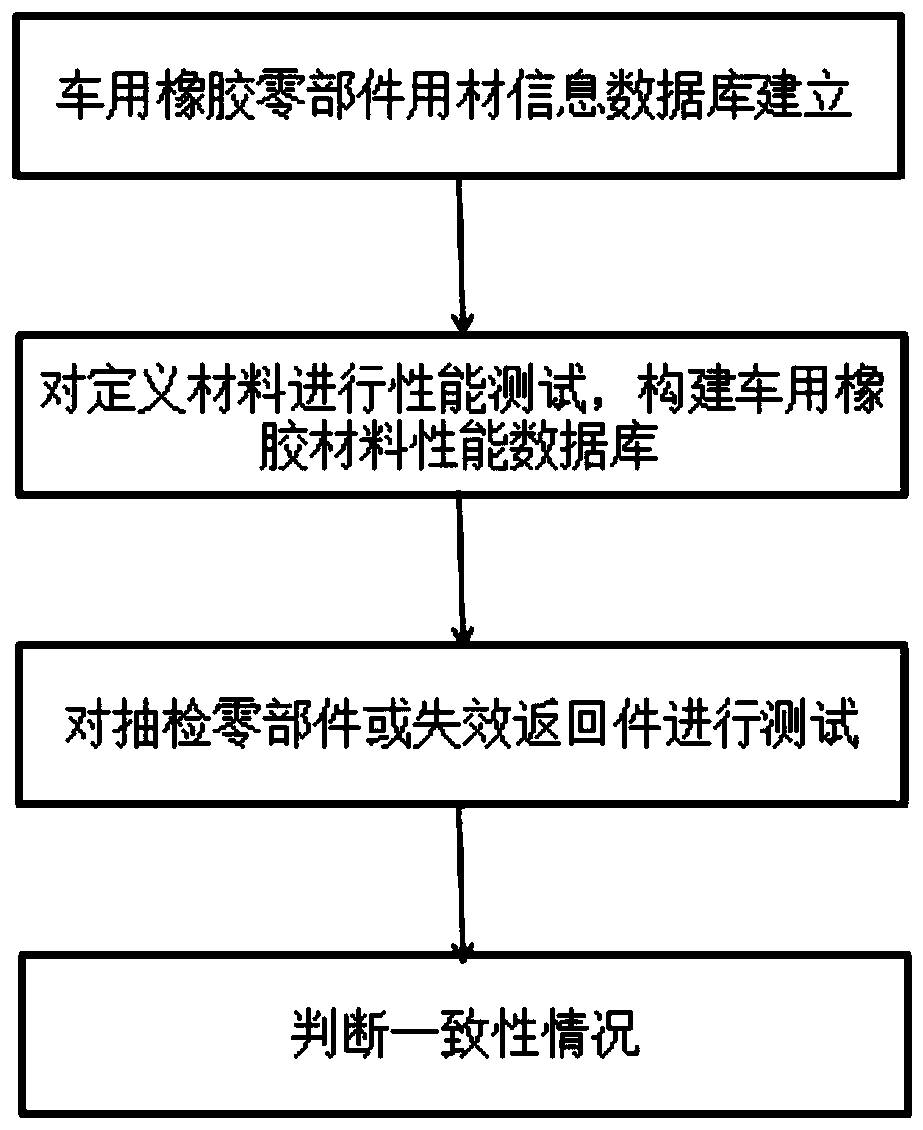
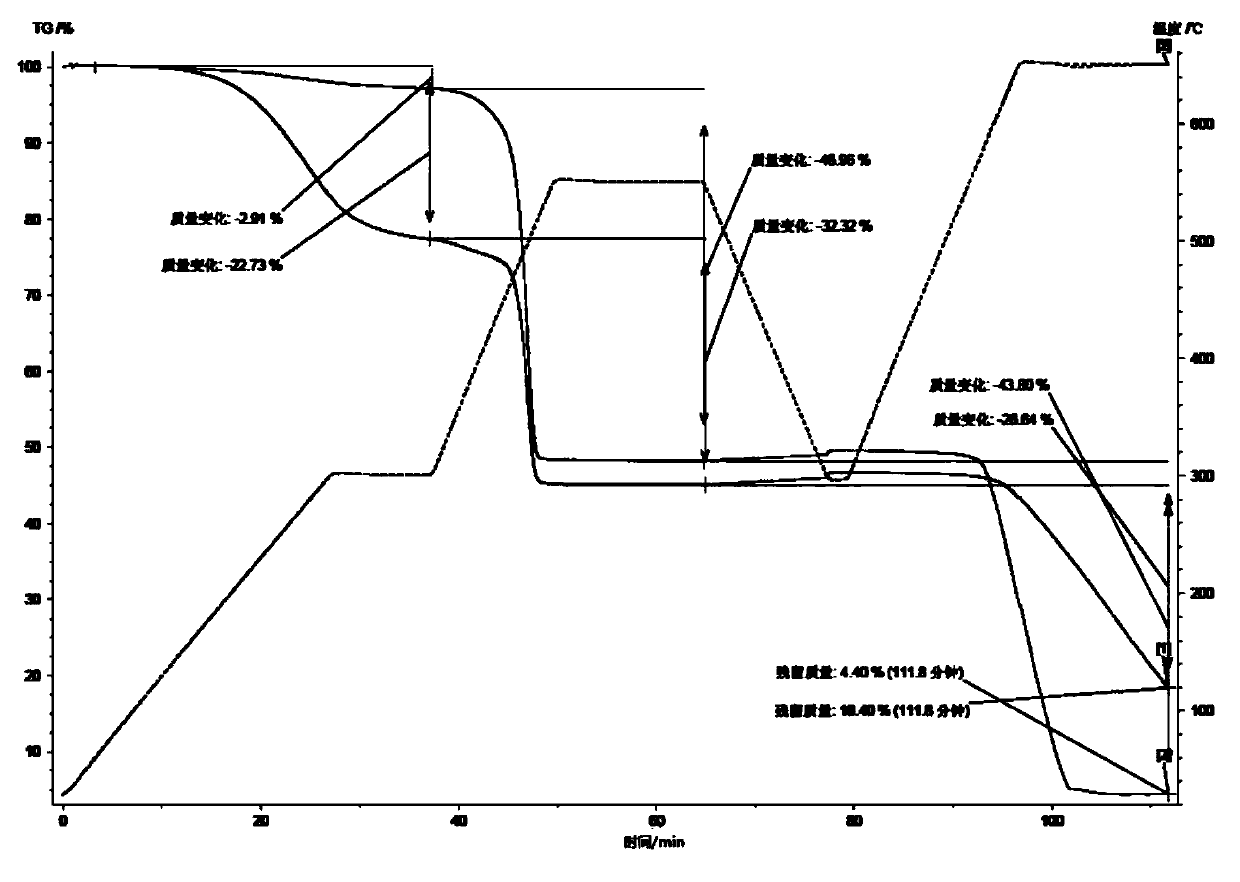
[0043] Pre-test whether the inner rubber material of a batch of rubber hoses is consistent with the drawing of the defined material (EPDM), and randomly select a sample from the rubber hoses supplied in batches for density, infrared spectrum and thermogravimetric tests as performance tests . (1) Density test results of defined material and bulk material are respectively: 1.12g / cm 3 and 1.17g / cm 3 , the deviation exceeds 0.05g / cm 3 ; (2) Obtain the thermal weight loss curve of the product through the TG test, compare it with the TG curve of the defined material, and get as follows figure 2 From the curve, it can be seen that the mass loss of the defined material and the sampling sample before 300°C are -2.91% and -22.73% respectively; the mass loss at 300°C~550°C is -48.96% and -32.32% respectively; -43.8% and -26.64%; the residual mass after 650°C is 4.4% and 18.4%, respectively, with a deviation of more than 5%. Therefore, it can be concluded that the material formula us...
Embodiment 2
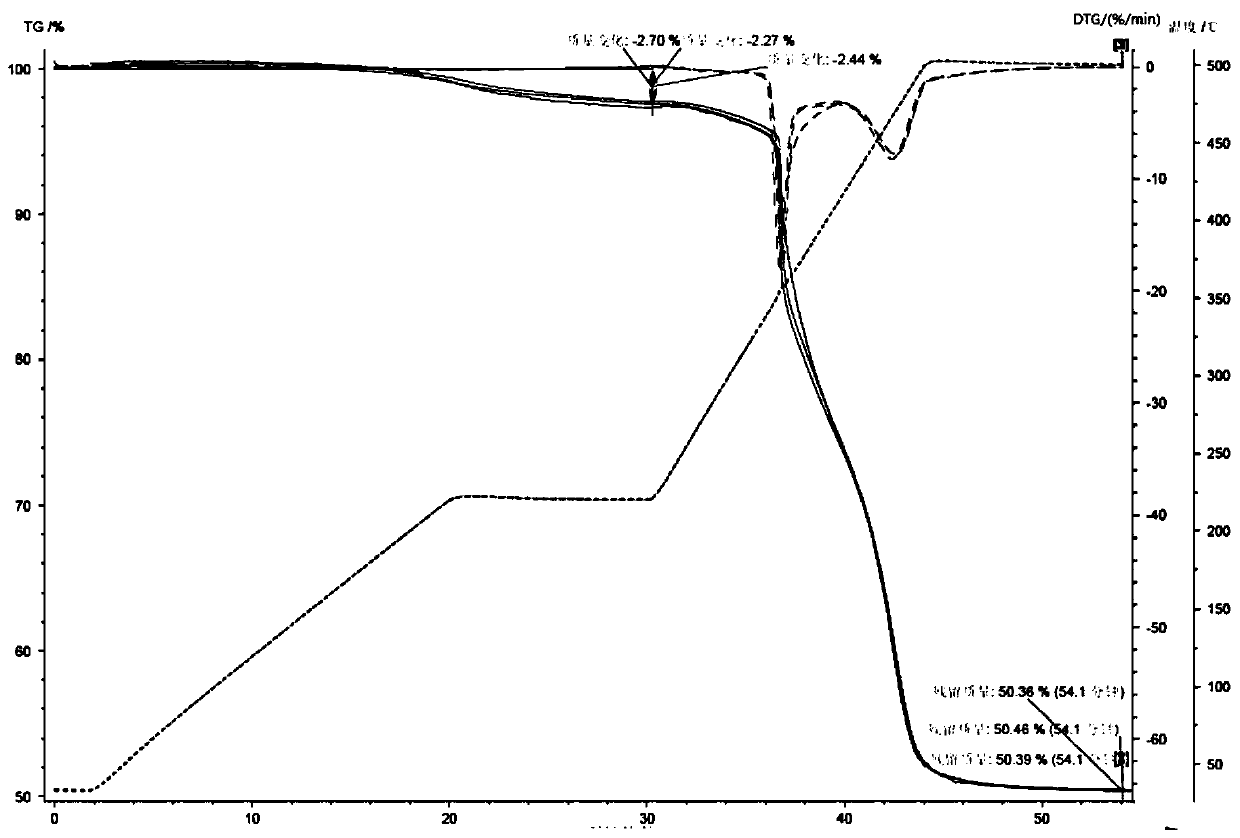
[0045] Pre-test whether the wiper rubber strip material supplied in a batch is consistent with the drawing (CR) of the defined material, and randomly select one piece from the rubber hose supplied in batches, and conduct density, infrared spectrum and thermogravimetric test performance tests. (1) Density test results of defined material and bulk material are respectively: 1.33g / cm 3 and 1.34g / cm 3 , the deviation is less than 0.05g / cm 3 ; (2) The thermal weight loss curve of the product is obtained through the TG test, and compared with the TGA curve in the material approval stage, the attached image 3 From the curve, it can be seen that the mass loss of the defined material and the sampling sample before 220°C are -6.89% and -7.73% respectively; the mass loss at 220°C~550°C is -49.96% and -48.96% respectively; are 43.25% and 43.31%, and the deviations are less than ±5%. Therefore, it can be concluded that the material formula used in batch products is consistent with the ...
PUM
| Property | Measurement | Unit |
|---|---|---|
| density | aaaaa | aaaaa |
| density | aaaaa | aaaaa |
Abstract
Description
Claims
Application Information
 - R&D
- Intellectual Property
- Life Sciences
- Materials
- Tech Scout
- Unparalleled Data Quality
- Higher Quality Content
- 60% Fewer Hallucinations
Browse by: Latest US Patents, China's latest patents, Technical Efficacy Thesaurus, Application Domain, Technology Topic, Popular Technical Reports.
© 2025 PatSnap. All rights reserved.Legal|Privacy policy|Modern Slavery Act Transparency Statement|Sitemap|About US| Contact US: help@patsnap.com


