Visualized topology platform layout method for big data of intelligent power grid

A smart grid and layout method technology, applied in the direction of electrical digital data processing, special data processing applications, instruments, etc., can solve problems such as the inability to provide management personnel scheduling basis, data intercommunication and interconnection without a complete connection relationship, and data association display. , to achieve the effect of optimizing operational efficiency

Inactive Publication Date: 2019-11-22
南京国科双创信息技术研究院有限公司
View PDF0 Cites 7 Cited by
  • Summary
  • Abstract
  • Description
  • Claims
  • Application Information

AI Technical Summary

Problems solved by technology

[0002] At this stage, the substations of the power grid are interconnected through distributed users and distributed power sources, and the interconnected transformers in the substations realize the interconnection of voltages at various levels. Each voltage level realizes flexible wiring through interconnected busbars, swit

Method used


Image

  • Visualized topology platform layout method for big data of intelligent power grid
  • Visualized topology platform layout method for big data of intelligent power grid

Examples


Embodiment Construction

[0029] Embodiments of the present invention are described below through specific examples, and those skilled in the art can easily understand other advantages and effects of the present invention from the content disclosed in this specification. The present invention can also be implemented or applied through other different specific implementation modes, and various modifications or changes can be made to the details in this specification based on different viewpoints and applications without departing from the spirit of the present invention. It should be noted that, in the case of no conflict, the following embodiments and features in the embodiments can be combined with each other.

[0030] It should be noted that the diagrams provided in the following embodiments are only schematically illustrating the basic ideas of the present invention, and only the components related to the present invention are shown in the diagrams rather than the number, shape and shape of the compo...


PUM


Abstract

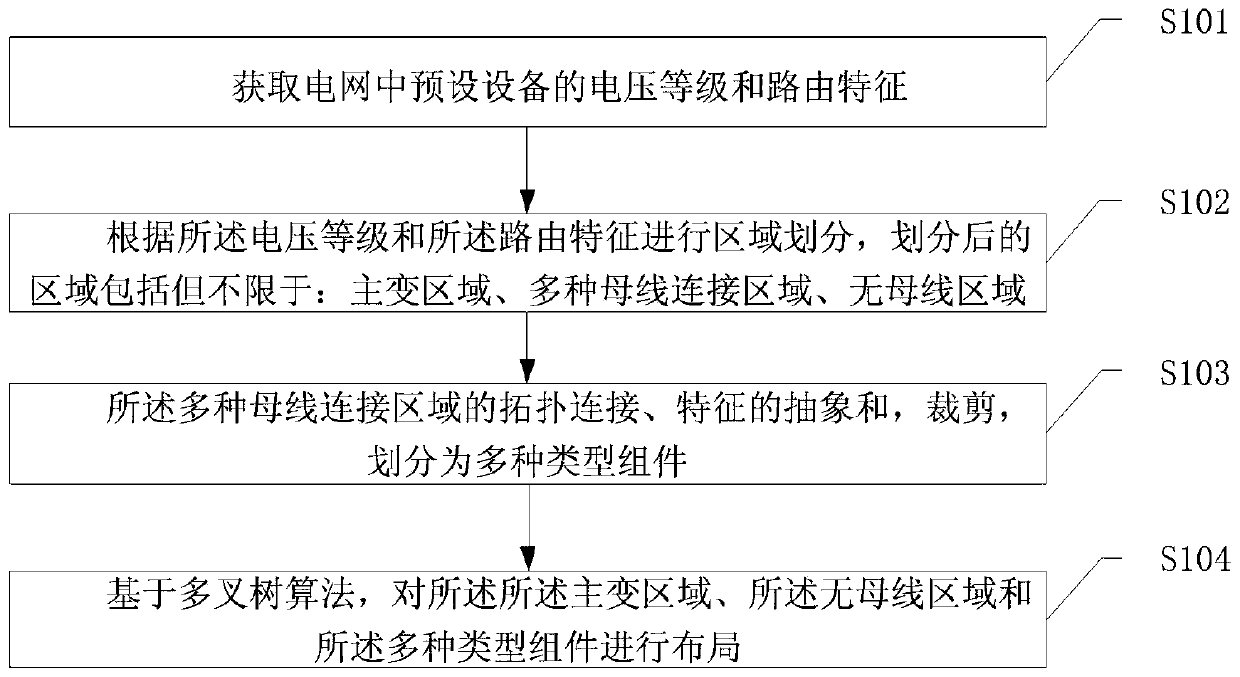
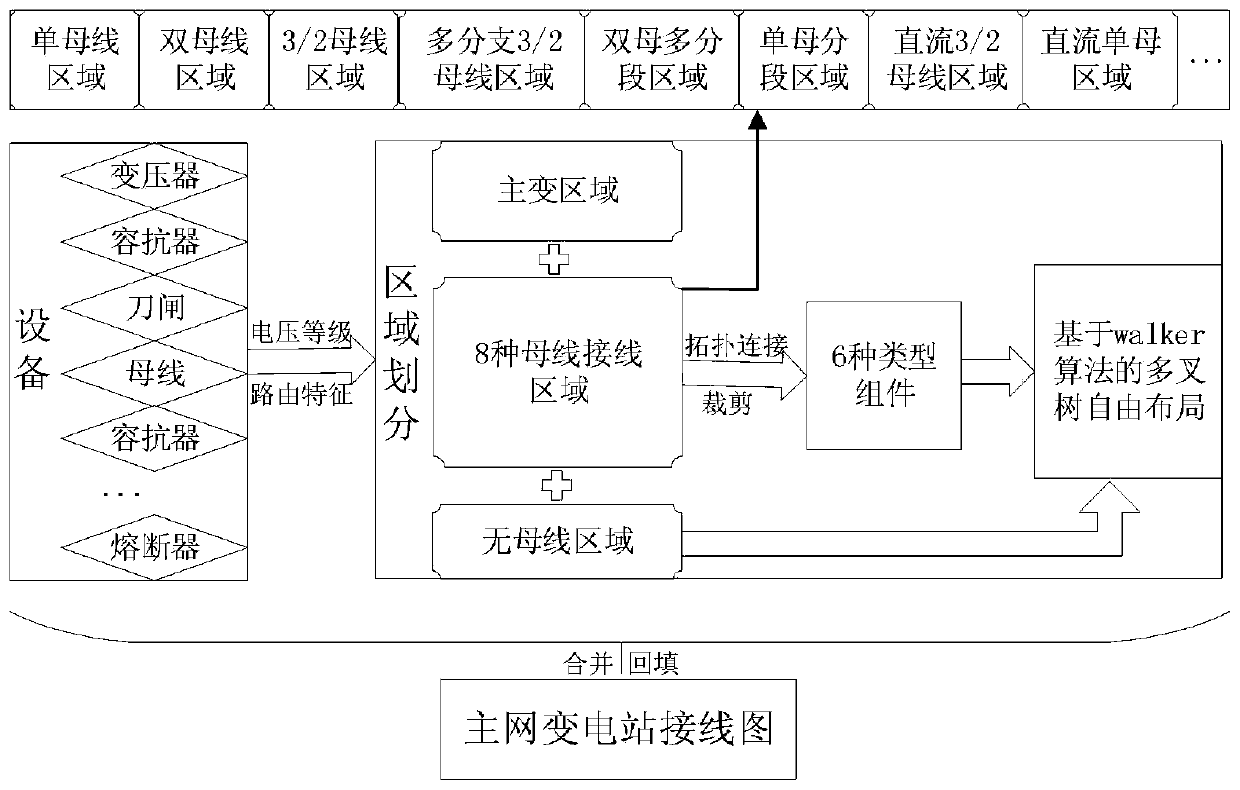
The invention discloses a visualized topology platform layout method for big data ofan intelligent power grid. The method comprises the steps of acquiring the voltage level and routing characteristicsof preset equipment in the power grid; performing region division according to the voltage level and the routing characteristics, wherein divided regions include but are not confined to a main transformer region, a plurality of bus connection regions and a bus-free region; topological connection and feature abstraction and tailoring of various bus connection areas are divided into various types of components; and based on a multi-way tree algorithm, a main transformer area, arranging a bus-free area and various types of components. The power grid is constructed into a through interconnected big data visual topology platform, and a connection relationship is established among power grid equipment, regions, transformer substations and the like. By integrating operation data, power grid data, power market data and the like, big data analysis is carried out by utilizing a topological network, the operation efficiency of energy production and energy consumption terminals is improved and optimized, and requirements and supply can be dynamically adjusted at any time.

Description

technical field [0001] The invention belongs to the technical field of power grid big data visualization, and in particular relates to a layout method of a smart power grid big data visualization topology platform. Background technique [0002] At this stage, the substations of the power grid are interconnected through distributed users and distributed power sources, and the interconnected transformers in the substations realize the interconnection of voltages at various levels. Each voltage level realizes flexible wiring through interconnected busbars, switches, and knife switches. However, there is no complete interconnection relationship between data, which eventually leads to all data being independent data islands. [0003] It can be seen that in the prior art, data cannot be effectively correlated and displayed, and effective scheduling basis cannot be provided to managers. Contents of the invention [0004] In view of the above-mentioned shortcomings of the prior a...

Claims


Application Information

Patent Timeline
IPC IPC(8): G06F17/50
Inventor 陈佳
Owner 南京国科双创信息技术研究院有限公司
Why Eureka
Try Eureka