Multi-source data visual analysis and display method and system

A multi-source data and data technology, applied in the field of data analysis, can solve problems such as difficult data, poor real-time display data, analysis and utilization, etc., to reduce workload and speed up analysis and application.

Pending Publication Date: 2020-02-04
广东机场白云信息科技股份有限公司
View PDF3 Cites 2 Cited by
  • Summary
  • Abstract
  • Description
  • Claims
  • Application Information

AI Technical Summary

Problems solved by technology
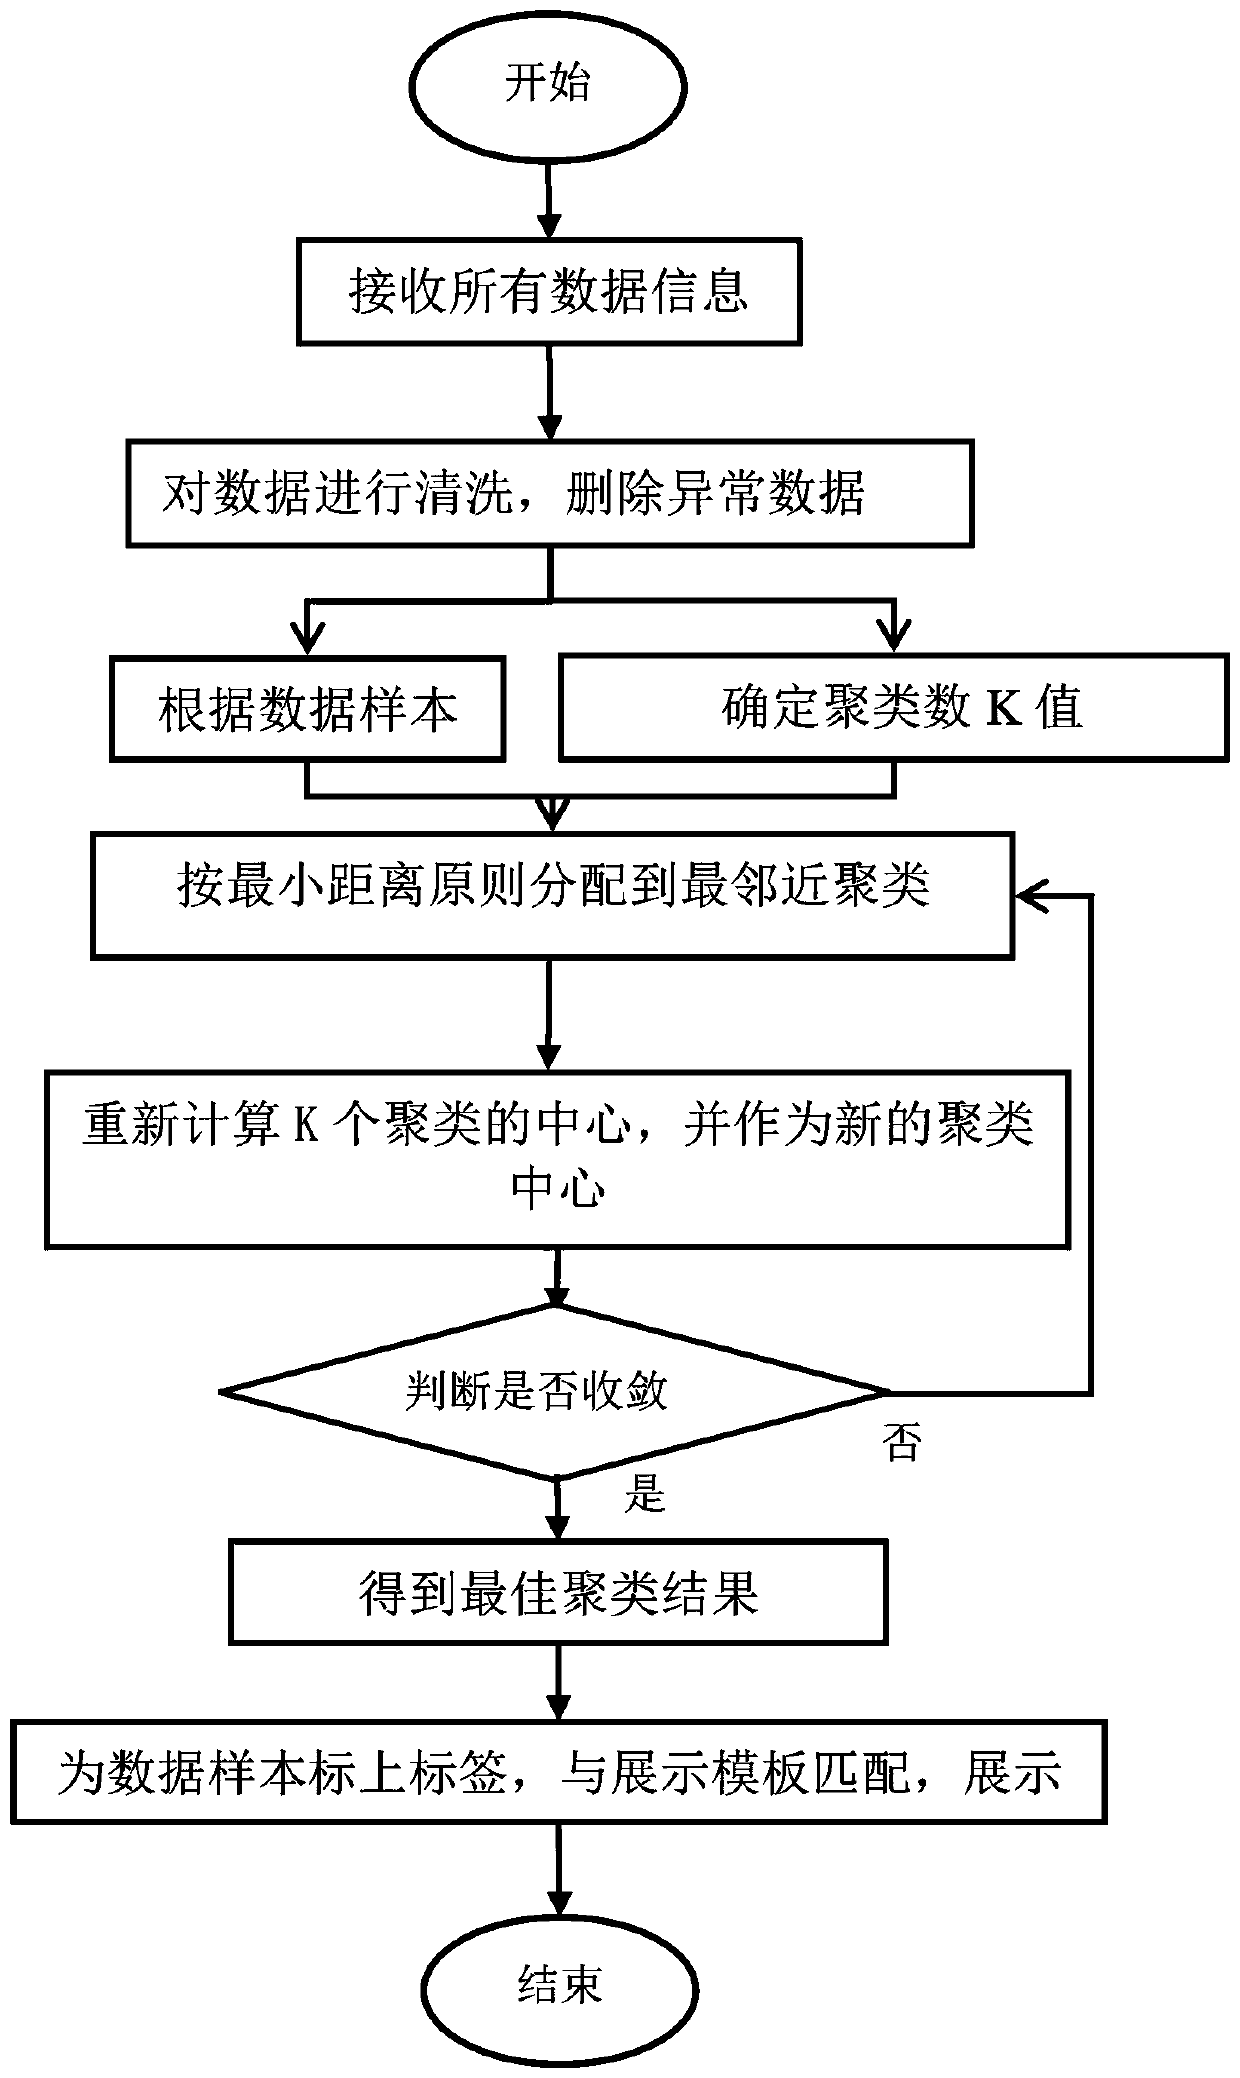
[0002] With the increasing demand for civil aviation, the amount of various types of data generated by airports is on the rise, such as various types of flight data, passenger data, security data, etc. The collection of various types of data is relatively scattered, resulting in slow data collection and analysis , leading to poor real-time display data
[0003] At present, the fundamental purpose of the visualization system of the airport is to use multimedia and multiple channels to realize the collaborative communication between air traffic control, airports, airlines and on-site units, integrate the data information owned by each unit, and pass the data through It is displayed in the form of charts, but the various types of data collected are large in number, and it is difficult to analyze and utilize the data

Method used


Image

  • Multi-source data visual analysis and display method and system

Examples


example 1

[0057] According to the types of possible data samples, example 1: including boarding personnel information, check-in personnel information, security personnel information and several types of information that cannot be determined, then initially set the K value to ≥ 5, and set the upper limit to random The predicted value is 15.

[0058] Suppose W≤K≤V, where W

[0059] When K=W (W=5 in the above-mentioned example), the various data information received are divided into K=W category, S={S1, S2,..., SW}, on this numerical model, that is to The following expression finds the minimum value:

[0060] According to the above expression, the mathematical expression can be obtained:

[0061] Among them, n is the number of samples, k is the clas...

example 2

[0070] In another embodiment, according to the data sample type, the size of the selected cluster number K value includes: when the type of data sample type has been clarified, example 2: the clarified data sample type includes aircraft on-site flight information, For air monitoring information and aircraft support information, the K value is directly selected, and K=3 in this example.

[0071] When the type of data sample type has been specified above, the K value is directly selected, specifically including:

[0072] According to the types of data samples that have been identified, set K=W (the value is 3 in the above example), S={S1, S2,..., SW}, on this numerical model, the following expression is calculated Minimum value:

[0073] According to the above expression, the mathematical expression can be obtained:

[0074] Among them, n is the number of samples, k is the classification value, and r nk Is whether the nth sample point belongs to the kth class, and if it b...


PUM


Abstract

The invention discloses a multi-source data visual analysis and display method and system. The multi-source data visual analysis and display method comprises the steps of receiving all data information, cleaning data, deleting abnormal data, and obtaining a data sample set; according to the type of the data sample, selecting the size of a clustering number K value; distributing the data samples inthe data sample set to the nearest neighbor cluster according to the minimum distance principle; recalculating the centers of the K clusters according to the nearest clustering result, and taking thecenters as new clustering centers; judging whether convergence occurs or not, namely judging whether the clustering center does not change any more, and if not, repeating until convergence to obtainan optimal clustering result; according to the optimal clustering result, marking corresponding labels on the data samples and enabling the labels to correspond to the display templates in a one-to-one mode, and conducting display. The multi-source data visual analysis and display system comprises a data sample processing module, a clustering number selection module, an approaching and clusteringmodule, a clustering center operation module, an optimal clustering operation module and a display module.

Description

technical field [0001] The present invention relates to the technical field of data analysis, in particular to a multi-source data visual analysis and presentation method and system. Background technique [0002] With the increasing demand for civil aviation, the amount of various types of data generated by airports is on the rise, such as various types of flight data, passenger data, security data, etc. The collection of various types of data is relatively scattered, resulting in slow data collection and analysis , leading to poor real-time display data. [0003] At present, the fundamental purpose of the visualization system of the airport is to use multimedia and multiple channels to realize the collaborative communication between air traffic control, airports, airlines and on-site units, integrate the data information owned by each unit, and pass the data through It is displayed in the form of charts, but the various types of data collected are large in number, making i...

Claims


Application Information

Patent Timeline
Patent Type & Authority Applications(China)
IPC IPC(8): G06F16/215G06F16/248G06K9/62
CPCG06F16/215G06F16/248G06F18/23213
Inventor 夏侯康曾林华王丽娟冯景亮
Owner 广东机场白云信息科技股份有限公司
Why Eureka
Try Eureka