
Intelligent data analysis visualization method based on big data

A technology of intelligent analysis and big data, applied in the field of visualization platform, can solve problems such as different statistical calibers, effective support for decision-making, high-level decision makers, enterprise key performance guidance and decision-making, etc., to reduce customer risks and meet business growth and changes Effect

Active Publication Date: 2020-02-11
安徽数据堂科技有限公司
View PDF6 Cites 14 Cited by
  • Summary
  • Abstract
  • Description
  • Claims
  • Application Information

AI Technical Summary

Problems solved by technology

Even though there were a large number of business reports in the early stage, there was no way to provide effective support for decision-making. Not only could high-level decision makers not be able to guide decision-making through key performance of the enterprise, but also the report requirements would continue to change, and the report development cycle was long and the statistical caliber was not the same. , and is limited by the display form of the report, it is impossible to make a humanized report;

Method used


Image

  • Intelligent data analysis visualization method based on big data
  • Intelligent data analysis visualization method based on big data
  • Intelligent data analysis visualization method based on big data

Examples


Embodiment Construction

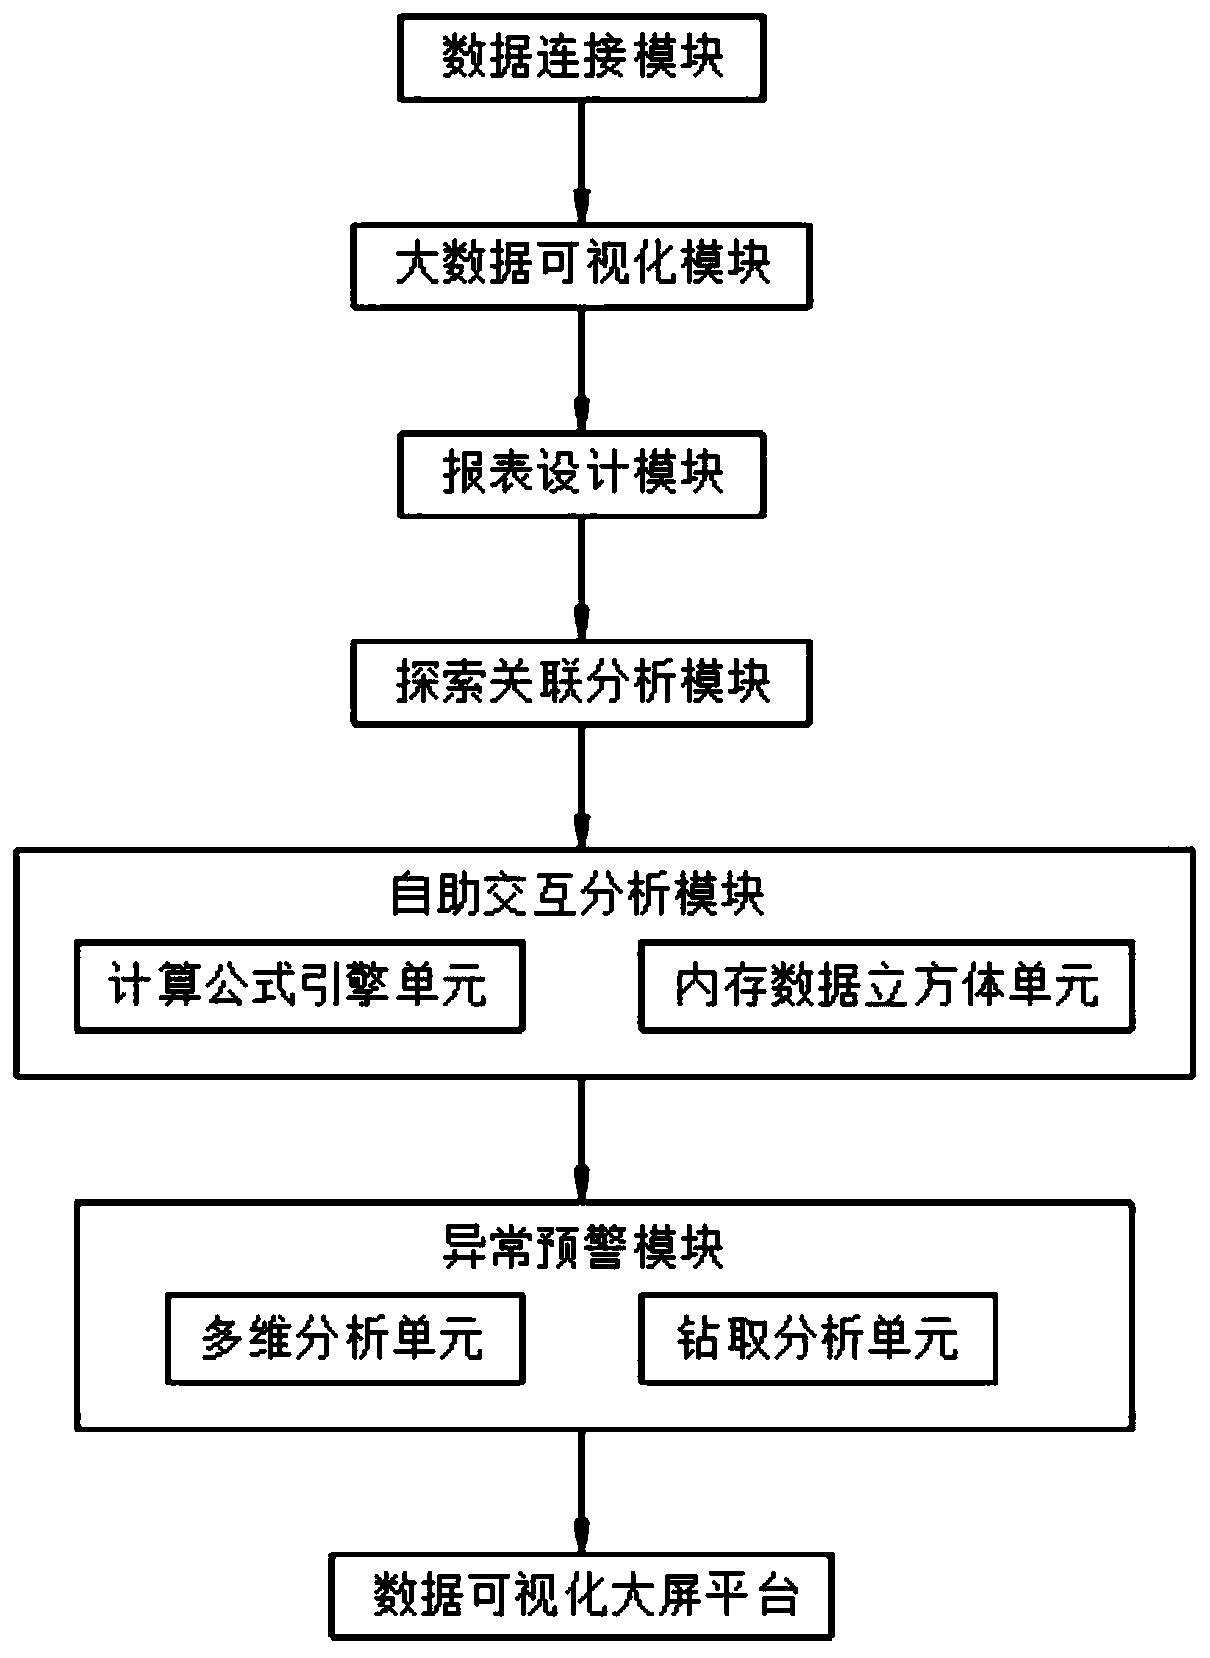
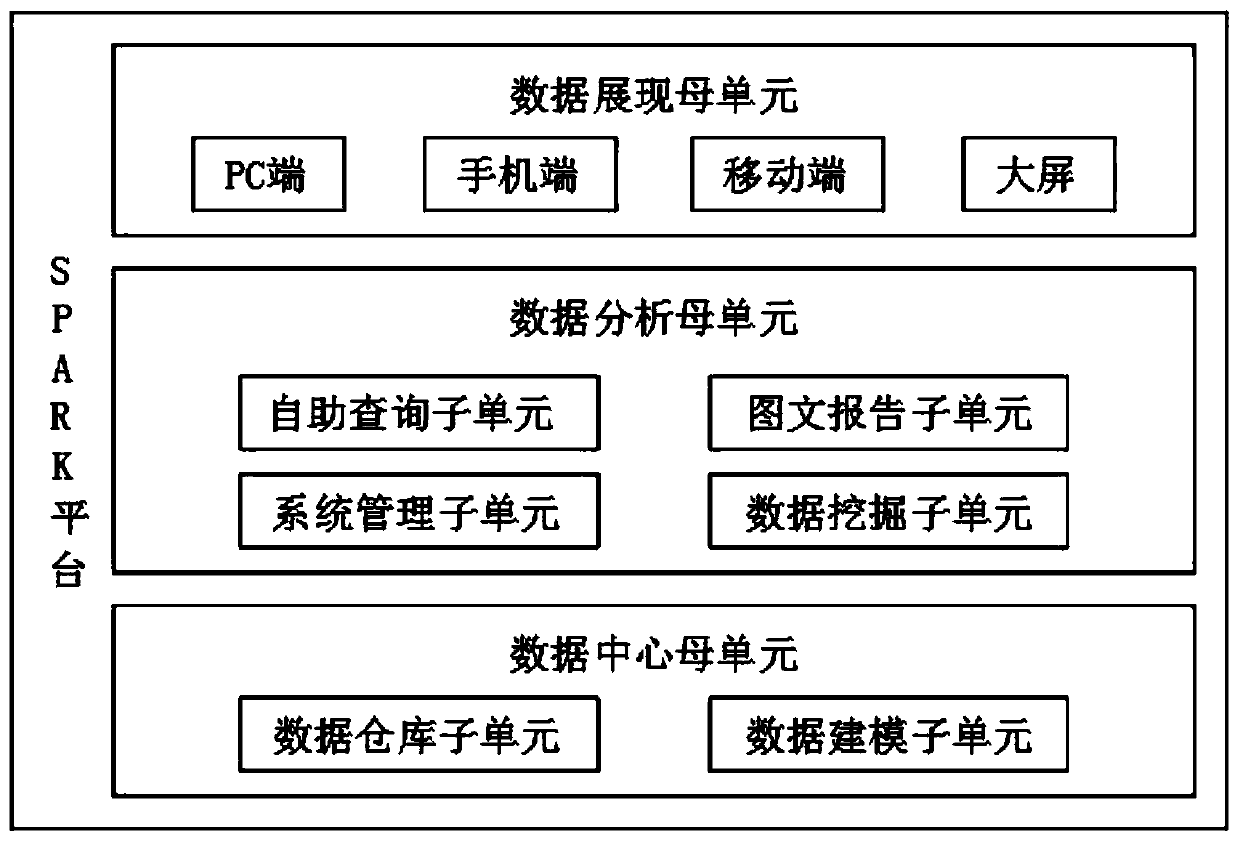
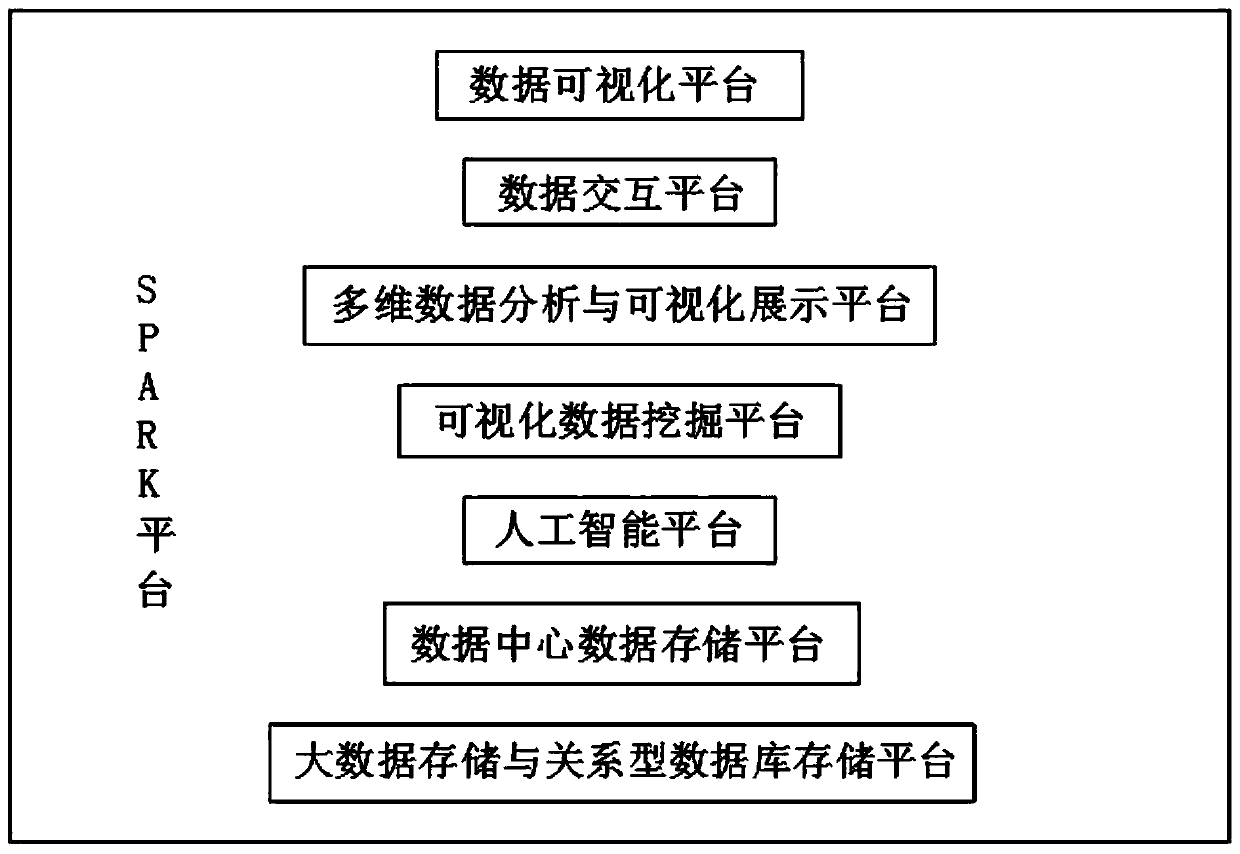
[0044] Such as Figure 1-3 As shown, a data intelligent analysis and visualization method based on big data includes the following steps:

[0045] Step 1: Load and import all kinds of structured and unstructured data embedded with access connectors, as well as all data in various relational databases and various big data storage files, into its Built-in SPARK platform, and transmit it to the big data visualization module accordingly;

[0046] It supports a variety of data sources, such as traditional relational data, columnar databases, cloud services, HADOOP, API, non-structural databases, EXCEL, and third-party platforms, etc.; and supports multiple access methods, such as JDBC, Web Services, HTTP request and manual import, etc.;

[0047] And the SPARK platform includes data center parent unit, data analysis parent unit and data presentation parent unit;

[0048] The data center parent unit is composed of a data warehouse subunit and a data modeling subunit. The data ware...


PUM


Abstract

The invention discloses an intelligent data analysis visualization method based on big data. The method comprises the following steps: step 1, loading and importing various structured and unstructureddata embedded with an access connector and all data existing in various relational databases and various big data storage files into a built-in SPARK platform through a data connection module; according to the method, a plurality of independent function modules are divided; modules and components required by different products can be flexibly selected, thereby analyzing the past, monitoring the present and predicting the future; various different databases or distributed databases are connected; connection and access to various big data storage platforms are supported; the data are merged, searched, visualized and analyzed, one-stop storage and management services are provided for customers, the customers are helped to leisurely face the rapid increase of the data and the uncertainty demand risk of a business system for storage, the risk of the customers is reduced, and meanwhile, the requirements of business increase and change can be met.

Description

technical field [0001] The invention relates to the technical field of visualization platform, in particular to a data intelligent analysis visualization method based on big data. Background technique [0002] Business intelligence is to use data warehouse and data mining technology to store and manage data systematically, and analyze it through various data statistical analysis tools to provide various analysis reports, such as customer value evaluation, customer satisfaction evaluation, service quality evaluation, Marketing effect evaluation and future market demand, etc., and then provide decision-making information for the company's business activities. [0003] With the continuous deepening of global economic integration, the competition among enterprises has gradually upgraded from the initial single product competition to comprehensive competition in various aspects such as product, technology, management and service. And data analysis can help enterprises optimize b...

Claims


Application Information

Patent Timeline
IPC IPC(8): G06F16/28G06F16/2458G06Q10/04
CPCG06F2216/03G06Q10/04G06F16/2465G06F16/284
Inventor 吴鑫坤张子斌
Owner 安徽数据堂科技有限公司
Learn More