Distribution area household meter phase relation inspection method based on voltage time sequence
A technology of distribution station area and phase relationship, applied to the phase angle between voltage and current, measuring electrical variables, measuring devices, etc., can solve the problem of inaccurate phase identification of user ammeters by low-voltage carrier waves, and eliminate the inaccuracy of voltage curves Compare and avoid the effect of signal crosstalk
- Summary
- Abstract
- Description
- Claims
- Application Information
AI Technical Summary
Problems solved by technology
Method used
Image
Examples
Embodiment 1
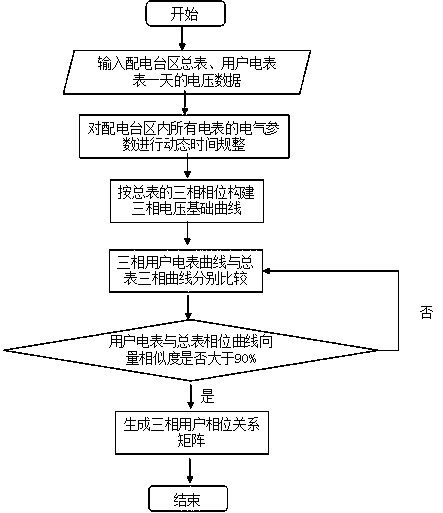
[0069] The present invention is realized through the following technical solutions, as figure 1 As shown, the method for verifying the phase relationship of household meters in distribution stations based on voltage time series is characterized in that: dynamic time adjustment is made to the electrical parameters corresponding to a voltage data of the general table of distribution stations and the user's electric meter, and three Phase voltage basic curve and three-phase user ammeter curve, analyze and compare the three-phase voltage basic curve and three-phase user ammeter curve, judge whether the curve vector similarity between the three-phase voltage basic curve and the three-phase user ammeter curve is greater than 90%, and compare the curves A three-phase user phase relationship matrix is generated if the vector similarity is greater than 90%.
[0070] It should be noted that, through the above improvements, the instantaneous voltage fluctuation of each phase on the low...
Embodiment 2
[0072] This embodiment is further optimized on the basis of the above embodiments, such as Figure 1-Figure 3 As shown, further, in order to better realize the present invention, the following steps are specifically included:
[0073] Step S1: Obtain two corresponding time series curves on the time axis within a certain period of time;
[0074] Step S2: Perform dynamic time adjustment on the electrical parameters of all the electric meters in the distribution station area;
[0075] Step S3: Construct the three-phase voltage basic curve and the three-phase consumer electric meter curve according to the phase of the master meter;
[0076] Step S4: Analyzing and comparing the three-phase voltage basic curve and the three-phase consumer ammeter curve;
[0077] Step S5: Determine whether the similarity of the curve vectors between the three-phase voltage basic curve and the three-phase user meter curve is less than 90%; if less than 90%, return to step S4 to analyze and compare a...
Embodiment 3
[0085] This embodiment is further optimized on the basis of the above embodiments, such as figure 1 As shown, the step S1 specifically refers to:
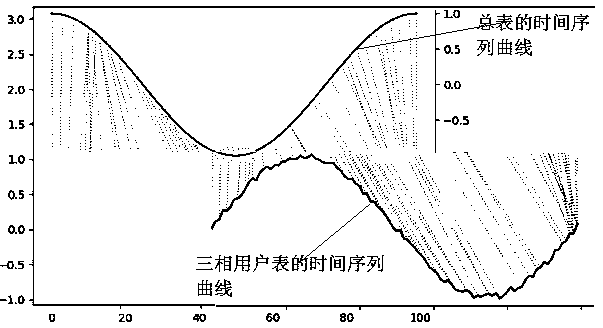
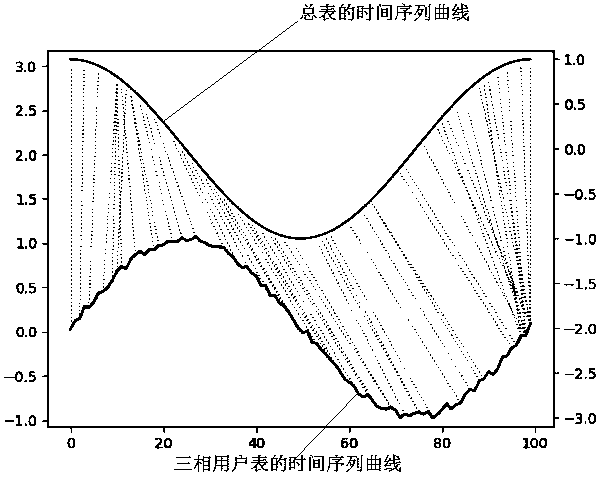
[0086] Input the voltage data of all general meters and three-phase user meters in the distribution station area for one day, and set two corresponding time series curves on the time axis within a certain period of time:
[0087] x=[x 1 、x 2 、x 3 ,...,x n ] (1)
[0088] y=[y 1 、y 2 、y 3 ,...,y n ] (2)
[0089] Among them: x represents the time series curve of the general table;
[0090] y represents the time series curve of the three-phase user meter.
[0091] It should be noted that, through the above improvements,
[0092] The other parts of this embodiment are the same as those of the foregoing embodiments, and thus will not be repeated here.
PUM
 Abstract
Description
Claims
Application Information
 - R&D
- Intellectual Property
- Life Sciences
- Materials
- Tech Scout
- Unparalleled Data Quality
- Higher Quality Content
- 60% Fewer Hallucinations
Browse by: Latest US Patents, China's latest patents, Technical Efficacy Thesaurus, Application Domain, Technology Topic, Popular Technical Reports.
© 2025 PatSnap. All rights reserved.Legal|Privacy policy|Modern Slavery Act Transparency Statement|Sitemap|About US| Contact US: help@patsnap.com


