[0059] The technical solutions in the embodiments of the present invention will be clearly and completely described below in conjunction with the accompanying drawings in the embodiments of the present invention. Obviously, the described embodiments are only a part of the embodiments of the present invention, rather than all the embodiments. Based on the embodiments of the present invention, all other embodiments obtained by those of ordinary skill in the art without creative work shall fall within the protection scope of the present invention.
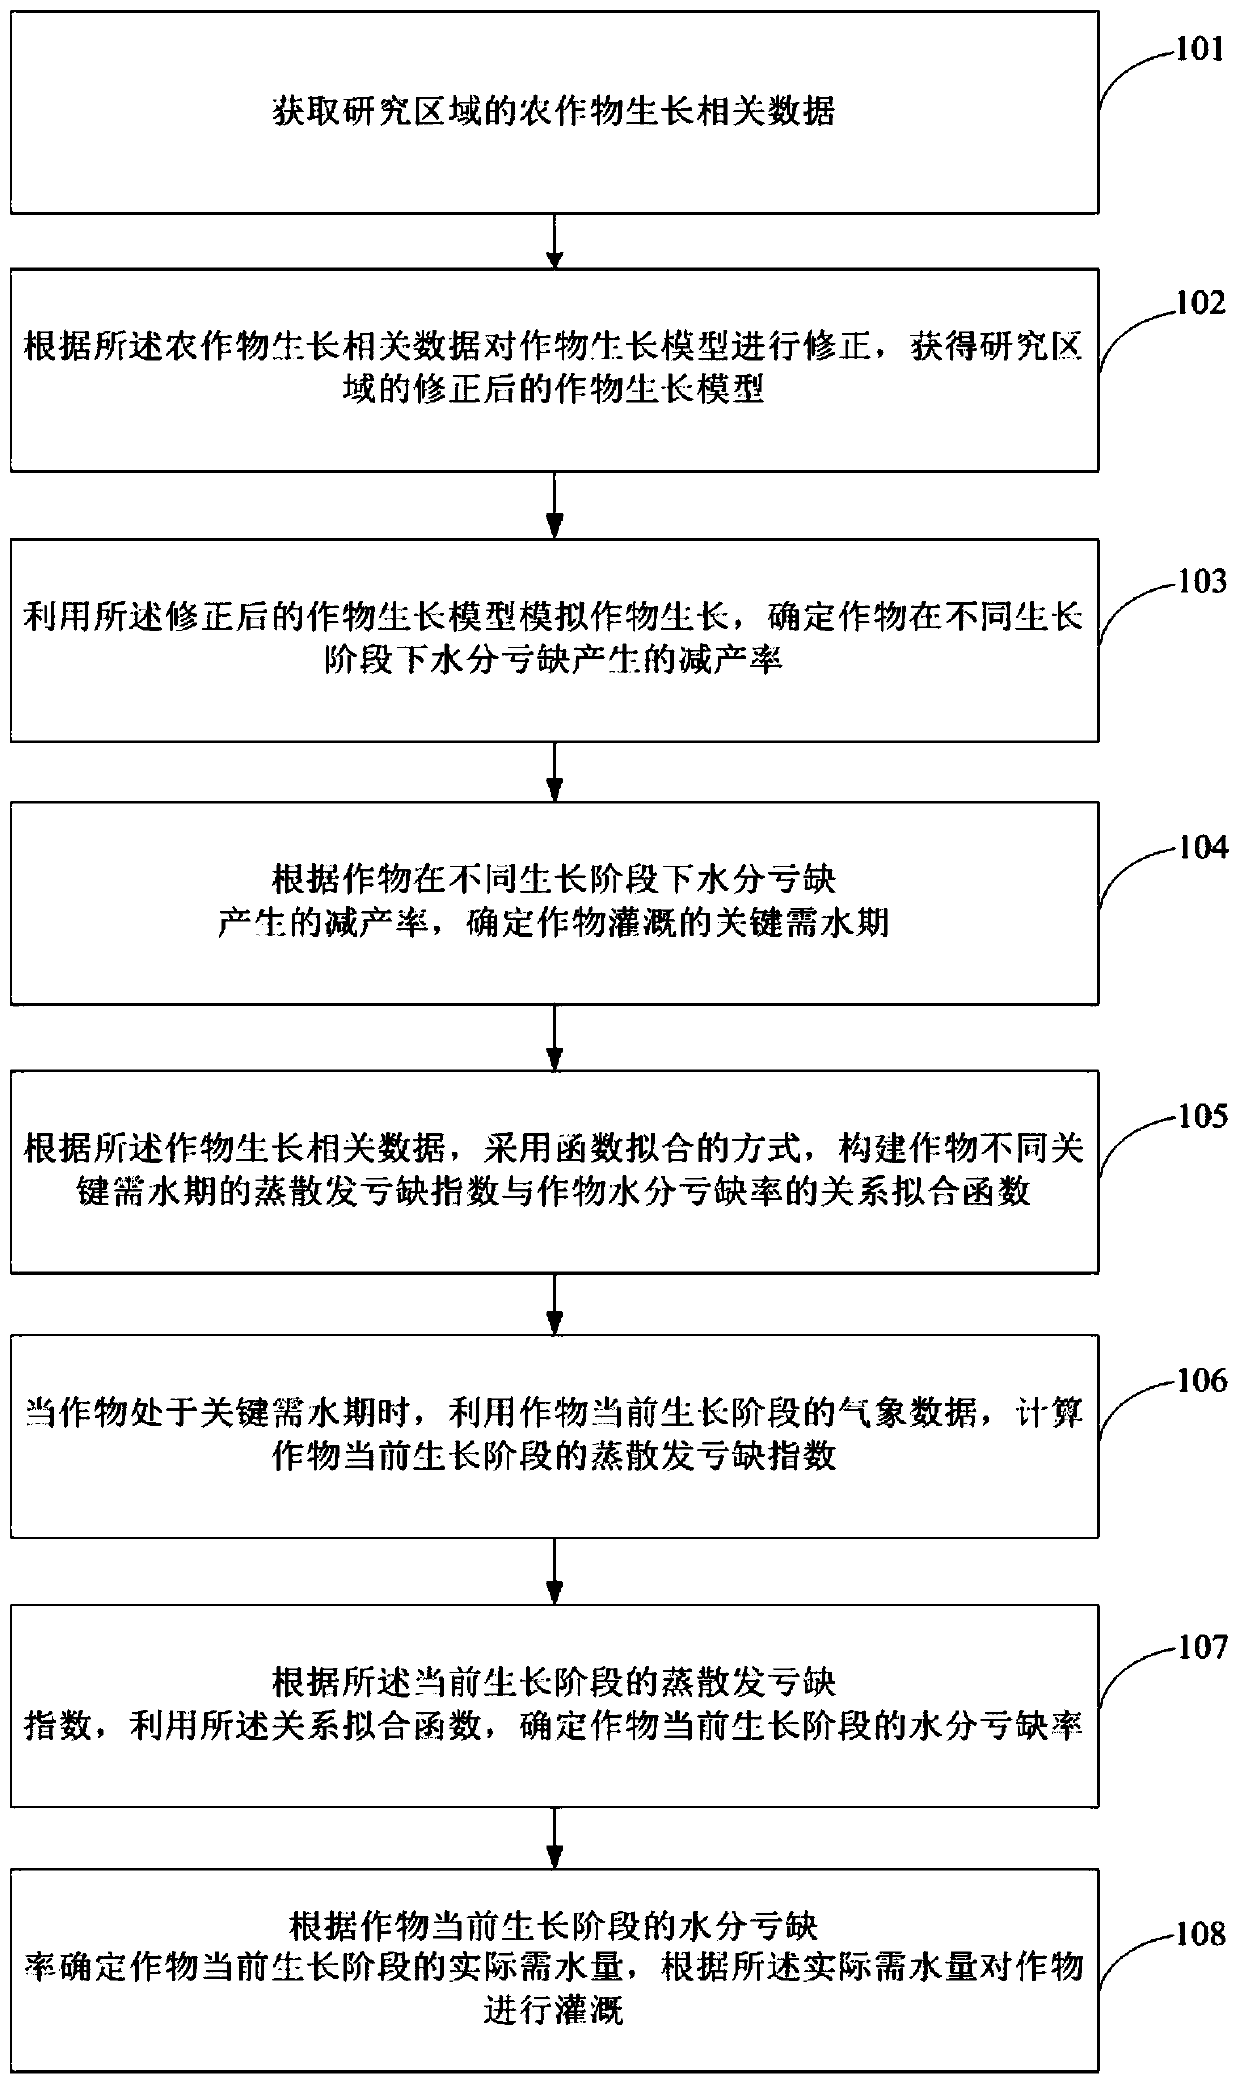
[0060] The purpose of the present invention is to provide an agricultural irrigation control method and system to improve the calculation accuracy of the water demand period and water demand of crops in different growth stages, so as to guide irrigation more scientifically and increase crop yields.
[0061] In order to make the above objectives, features and advantages of the present invention more obvious and understandable, the present invention will be further described in detail below with reference to the accompanying drawings and specific embodiments.
[0062] Such as figure 1 with 2 As shown, the present invention provides an agricultural irrigation control method, which includes the following steps:
[0063] Step 101: Obtain crop growth-related data in the research area. The crop growth-related data includes meteorological data, soil type and distribution data, crop yield data, crop growth data, and crop field management observation data. Specifically, the types and acquisition methods of crop growth-related data are shown in Table 1 and figure 2 Shown.
[0064] Table 1 Data sheet related to crop growth
[0065]
[0066]
[0067] Step 102: Calibrate the crop growth model according to the crop growth related data, and obtain the revised crop growth model of the research area.
[0068] The AquaCrop model is a crop growth model developed by FAO and promoted globally. It has the advantages of high model transparency, balanced design, and relatively simple input data requirements. The AquaCrop model can simulate the effects of changes in different water conditions on photosynthesis, water production efficiency, and water stress, and can describe the growth and development of crops in detail. It is one of the important tools for studying agricultural drought disaster management and the impact of drought disasters on agriculture.
[0069] Step 102 specifically includes: inputting the meteorological data of the crop growth-related data into the crop growth model to obtain the simulated yield of the crop; calculating the relative root mean square error and the consistency coefficient of the difference between the simulated yield of the crop and the actual yield; Whether the relative root mean square error is less than the root mean square error threshold and whether the consistency coefficient is greater than the consistency coefficient threshold, the judgment result is obtained; if the judgment result indicates that the relative root mean square error is not less than the root mean square error threshold or If the consistency coefficient is not greater than the consistency coefficient threshold, use the parameter calibration tool of the crop growth model to correct the parameters of the calibration model, and return to step "input meteorological data of the crop growth related data into the crop growth model Obtain the simulated yield of crops"; if the judgment result indicates that the relative root mean square error is less than the root mean square error threshold and the consistency coefficient is greater than the consistency coefficient threshold, output the crop growth model as the corrected crop Growth model.
[0070] Specifically, the calibration and verification of model parameters is the basis for scientific research and practical application of crop growth models. Because crop growth models are equations that describe the growth behavior of different crops, these equations are derived from experimental empirical formulas, and many parameters vary with time, place, and type of variety. Therefore, when using the model, these parameters need to be calibrated, that is, model localization.
[0071] The localization process of the AquaCrop model includes calibration and verification. The water control experiment data and the multi-year output data and growth period data of multiple agrometeorological observation stations in the study area are required to calibrate them separately, and verify the corrected data in the region. Adaptability of the AquaCrop model.
[0072] Input data to calibrate model parameters: select the agrometeorological observation data near the study area to calibrate the parameters of crop varieties site by site. The input agrometeorological observation data include temperature, atmospheric pressure, wind speed, precipitation, etc.
[0073] The method of model parameter calibration is to use relative root mean square error (N_RMSE) and consistency coefficient (d) to calibrate and verify the accuracy of model parameter calibration. The specific formula is as formula (1-4).
[0074] Crop model parameter calibration: harvest index, optimum temperature for plant growth, minimum temperature for plant growth, maximum root depth, maximum temperature for vegetation growth rate reduction, total growth days, initial canopy coverage, etc.
[0075]
[0076]
[0077]
[0078]
[0079] Where C oi (i=1,...,N) is the output of each year in a normal year, C si (i=1,...,N) is the model to simulate the output of each year. C o It is the normal annual average output.
[0080] When N_RMSE is less than 10%, the simulation effect of the model is considered to be good, when N_RMSE is between 10% and 20%, the simulation effect is considered to be good, and when N_RMSE is between 20% and 30%, the simulation effect is considered not bad, and the consistency index is The closer d is to 1, the better the agreement between the simulated value and the observed value, and the closer to 0, the worse the agreement between the simulated value and the observed value. When N_RMSE is greater than 30% or the consistency means d is close to 0, the model needs to be recalibrated.
[0081] Step 103: Use the modified crop growth model to simulate crop growth, and determine the yield reduction rate of crops due to lack of water at different growth stages. The growth stage is a preset time interval during the growth of the crop. The growth stage can be one week, one month, or each growth period of the crop. Preferably, the growth stage is one week.
[0082] Step 104: Determine the critical water requirement period for crop irrigation according to the crop yield reduction rate caused by water shortage in different growth stages; the critical water requirement period is the growth stage of the crop whose yield reduction rate is greater than the yield reduction rate threshold.
[0083] Steps 103-104 specifically include: dividing the crop growth season into several growth stages on a weekly scale, simulating the growth process under water deficit in each growth stage based on the revised crop growth model, and taking the yield reduction rate as an evaluation indicator, analyzing The impact of water deficit in different periods on yield, so as to determine the critical period when crops require the most water.
[0084] The model simulates the water deficit data of different growth periods: setting the water supply conditions by controlling the precipitation in stages, setting the precipitation deficit control with different starting times and different durations on a weekly basis, using the AquaCrop model as a tool Simulate the growth process of crops under water deficit conditions of different initial periods and different durations, and use the yield reduction rate as an evaluation indicator to compare the yield under the water deficit situation with the annual yield of the reference year (normal year) Reduction rate.
[0085] Calculate the meteorological data of the reference year: the precipitation of the reference year is the average value of precipitation for many years, and then the method of weekly construction is adopted. The specific principle is as image 3 As shown, image 3 in, Represents the precipitation of the mth week of the i-th year, Represents the mean value of n-year precipitation in week m, P m Represents the meteorological conditions (including temperature, atmospheric pressure, wind speed, precipitation) in the m-th week of the year in which the precipitation of the mth week is closest to the average value of the n-year precipitation of the week, P Reference year It is the meteorological condition of the reference year where the constructed precipitation is closest to the historical average.
[0086] Respectively simulate no precipitation for one consecutive week, no precipitation for two consecutive weeks, no precipitation for three consecutive weeks and no precipitation for four consecutive weeks. Input the above scenarios into the model to simulate the water shortage at different stages of the crop development process, and calculate the relative yield reduction rate at different stages.
[0087] Determine the critical water demand period that affects the yield of crops: the rate of yield reduction is an important index that characterizes the degree of damage to crops. It refers to the ratio of the actual yield per unit area to the average yield at the local productivity level to the local average yield, expressed as a percentage. The formula for the reduction rate of crops caused by the deficit is expressed as:
[0088]
[0089] Where Y i,j Is the yield reduction rate caused by no precipitation for consecutive i weeks in j growth stages, Y i,jsimu Yield under the condition of no precipitation for consecutive i weeks at the beginning of the jth week of the growing season simulated by the crop growth model, Y refer It is the output of the reference year (that is, the output of the normal year). The output of the reference year is obtained by simulating the growth and development process of the reference year by the AquaCrop model.
[0090] Calculate the yield reduction rate caused by water deficit in 1-4 weeks, and the range where the yield reduction rate is greater than the yield reduction rate threshold is the water requirement period for crop growth.
[0091] Step 105: According to the crop growth related data, a function fitting method is used to construct a fitting function of the relationship between the evapotranspiration deficit index and the crop water deficit rate in different critical water demand periods of the crop.
[0092] Specifically, it includes: according to the crop growth related data, the first-order Fourier function is used for fitting, and the fitting function of the relationship between the evapotranspiration deficit index and the crop water deficit rate in different key water demand periods of the crop is determined as:
[0093] CWDR i = F i (ETDI i )
[0094] f i (ETDI i )=a 0i +a 1i (cos(ETDI i ×w i )+b 1i ×sin(ETDI i ×w i ))
[0095] Among them, CWD i Indicates the crop water deficit rate in the i-th critical water demand period; ETDI i Represents the evapotranspiration deficit index of the i-th critical water demand period; f i (·) represents the relationship fitting function of the i-th critical water demand period, a 0i , A 1i , W i And b 1i Respectively represent the first fitting parameter, the second fitting parameter, the third fitting parameter and the fourth fitting parameter of the relationship fitting function of the i-th key water demand period.
[0096] Specifically, ETDI at different growth stages is used as an independent variable, namely ETDI i , CWD is used as the dependent variable, and the first-order Fourier function is used for fitting to obtain the functional relationship between the two.
[0097] Step 106: When the crop is in the critical water demand period, the meteorological data of the current growth stage of the crop is used to calculate the evapotranspiration deficit index of the current growth stage of the crop.
[0098] It specifically includes: using the meteorological data of the current crop growth stage, using PM (Penman-monteith) algorithm, TW (Thornthwaite) algorithm or PT (Priestlev-tavlor) algorithm to calculate the reference crop evapotranspiration of the crops in the research area; calculating the reference crop evapotranspiration The difference between the amount of growth and the amount of precipitation in the current growth stage of the study area is used as the evapotranspiration deficit index of the current growth stage of the crop.
[0099] Step 107: Determine the water deficit rate of the crops in the current growth stage by using the relationship fitting function according to the evapotranspiration deficit index in the current growth stage;
[0100] Step 108: Determine the actual water requirement of the crop at the current growth stage according to the water deficit rate at the current growth stage of the crop, and irrigate the crop according to the actual water requirement.
[0101] Specifically, the crop water deficit rate (CWDR) is the ratio of the difference between the actual water demand of the crops and the available water in a certain period of time to the actual water demand of the crops in the same period. Deformation can obtain the actual water demand of the crops in different growth periods ET mi , The formula is as follows:
[0102]
[0103] Among them, ET ai It is the difference between actual water demand and available water for crops in different growth periods.
[0104] The present invention also provides an agricultural irrigation control system, which includes:
[0105] The crop growth related data acquisition module is used to acquire crop growth related data in the research area, the crop growth related data includes meteorological data, soil type and distribution data, crop yield data, crop growth data, and crop field management observation data;
[0106] The crop growth model calibration module is used to calibrate the crop growth model according to the crop growth related data to obtain the revised crop growth model of the research area.
[0107] The crop growth model calibration module specifically includes: a simulated yield obtaining sub-module for inputting meteorological data of the crop growth-related data into the crop growth model to obtain the simulated yield of the crop; a relative root mean square error and consistency coefficient calculator The module is used to calculate the relative root mean square error and the consistency coefficient of the difference between the simulated yield and the actual yield of crops; the judgment sub-module is used to judge whether the relative root mean square error is less than the root mean square error threshold and the Whether the consistency coefficient is greater than the consistency coefficient threshold, the judgment result is obtained; the calibration sub-module is used for if the judgment result indicates that the relative root mean square error is not less than the root mean square error threshold or the consistency coefficient is not greater than the Consistency coefficient threshold, use the parameter calibration tool of the crop growth model to calibrate the parameters of the calibration model, and return to the step of "input the meteorological data of the crop growth related data into the crop growth model to obtain the simulated output of the crop"; model output A sub-module for outputting the crop growth model as a modified crop growth model if the judgment result indicates that the relative root mean square error is less than the root mean square error threshold and the consistency coefficient is greater than the consistency coefficient threshold .
[0108] The yield reduction rate determination module is used for simulating the growth of crops using the modified crop growth model, and determining the yield reduction rate of crops due to lack of water at different growth stages;
[0109] The critical water demand period determination module is used to determine the critical water demand period for crop irrigation according to the yield reduction rate of crops in different growth stages due to lack of water; the critical water demand period is the growth stage of crops whose yield reduction rate is greater than the yield reduction rate threshold ;
[0110] The function fitting module is used to construct the relationship fitting function between the evapotranspiration deficit index and the crop water deficit rate in different key water demand periods of the crops in the manner of function fitting according to the crop growth related data.
[0111] The function fitting module specifically includes: a function fitting sub-module for fitting according to the crop growth related data using a first-order Fourier function to determine the evapotranspiration deficit index of the crop in different critical water demand periods The fitting function of the relationship with crop water deficit rate is:
[0112] CWDR i = F i (ETDI i )
[0113] f i (ETDI i )=a 0i +a 1i (cos(ETDI i ×w i )+b 1i ×sin(ETDI i ×w i ))
[0114] Among them, CWDR i Indicates the crop water deficit rate in the i-th critical water demand period; ETDI i Represents the evapotranspiration deficit index of the i-th critical water demand period; f i (·) represents the relationship fitting function of the i-th critical water demand period, a 0i , A 1i , W i And b 1i Respectively represent the first fitting parameter, the second fitting parameter, the third fitting parameter and the fourth fitting parameter of the relationship fitting function of the i-th key water demand period.
[0115] The evapotranspiration deficit index calculation module is used to calculate the evapotranspiration deficit index at the current growth stage of the crop using the meteorological data at the current growth stage of the crop when the crop is in the critical water demand period.
[0116] The evapotranspiration deficit index calculation module specifically includes: a reference crop evapotranspiration calculation sub-module, which is used to use meteorological data at the current growth stage of crops, using PM (Penman-monteith) algorithm, TW (Thornthwaite) algorithm or PT ( Priestlev-tavlor) algorithm calculates the reference crop evapotranspiration of the crops in the research area; the evapotranspiration deficit index calculation sub-module is used to calculate the difference between the reference crop evapotranspiration and the precipitation in the current growth stage of the research area as a crop The evapotranspiration deficit index for the current growth stage.
[0117] The water deficit rate determination module is used to determine the water deficit rate of the crop in the current growth stage by using the relationship fitting function according to the evapotranspiration deficit index in the current growth stage.
[0118] The actual water demand determination module is used to determine the actual water demand of the crop in the current growth stage according to the water deficit rate in the current growth stage of the crop, and irrigate the crop according to the actual water demand.
[0119] Compared with the prior art, the beneficial effects of the present invention are:
[0120] The present invention provides an agricultural irrigation control method and system. The control method firstly calibrates the crop growth model based on crop growth related data, and performs function fitting on the relationship between the evapotranspiration deficit index and the crop water deficit rate , And then determine the critical water demand period with the aid of the modified crop growth model, calculate the water demand in the critical water storage period according to the relationship fitting function, and obtain the long-term data of different regions by the modified crop growth model and the relationship fitting function The support of, improves the calculation accuracy of water demand period and water demand of crops in different growth stages, and then guides irrigation more scientifically and improves crop yield.
[0121] The equivalent embodiments in this specification are described in a progressive manner, each embodiment focuses on the differences from other embodiments, and the same or similar parts between the equivalent embodiments can be referred to each other.
[0122] Specific examples are used in this article to illustrate the principles and implementation of the present invention. The description of the above examples is only used to help understand the method and core idea of the present invention; at the same time, for those of ordinary skill in the art, according to the present invention There will be changes in the specific implementation and scope of application. In summary, the content of this specification should not be construed as a limitation of the present invention.