Marine data visualization method and device

A marine data and marine technology, applied in the computer field, can solve the problem of not being able to display marine data to users with 3D images

Active Publication Date: 2020-09-08
INSPUR COMMON SOFTWARE
View PDF10 Cites 4 Cited by
  • Summary
  • Abstract
  • Description
  • Claims
  • Application Information

AI Technical Summary

Problems solved by technology

However, in the existing technology, the visualization processing of ocean data is mainly to generate statistical charts for various types of features in ocean data, and it is impossible to display ocean data to users with three-dimensional images

Method used


Image

  • Marine data visualization method and device
  • Marine data visualization method and device
  • Marine data visualization method and device

Examples


Embodiment Construction

[0062]In order to make the purpose, technical solutions and advantages of the embodiments of the present invention clearer, the technical solutions in the embodiments of the present invention will be clearly and completely described below in conjunction with the drawings in the embodiments of the present invention. Obviously, the described embodiments It is a part of the embodiments of the present invention, but not all of them. Based on the embodiments of the present invention, all other embodiments obtained by those of ordinary skill in the art without creative work belong to the protection of the present invention. scope.

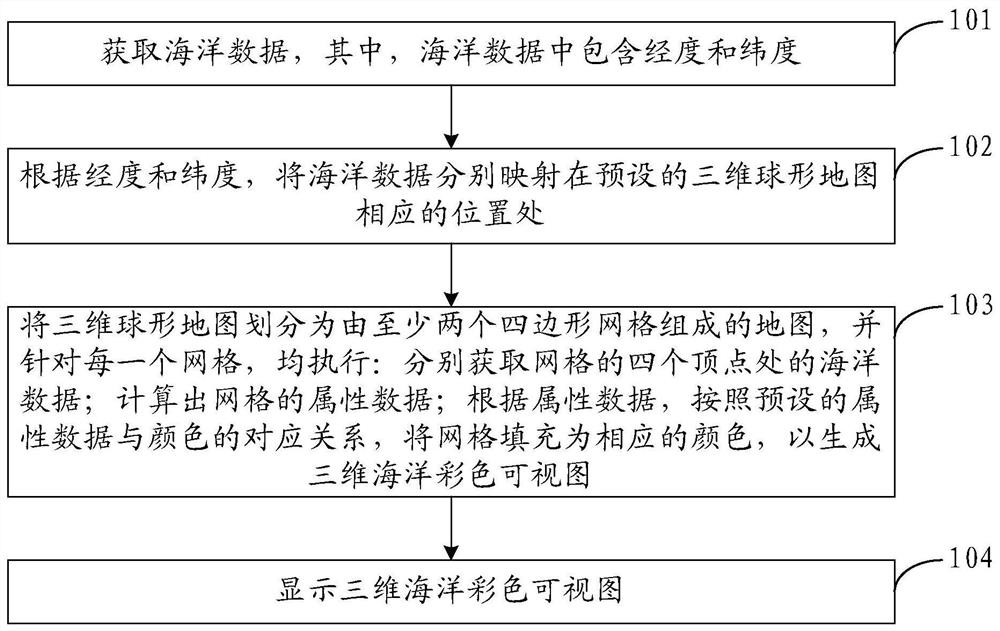
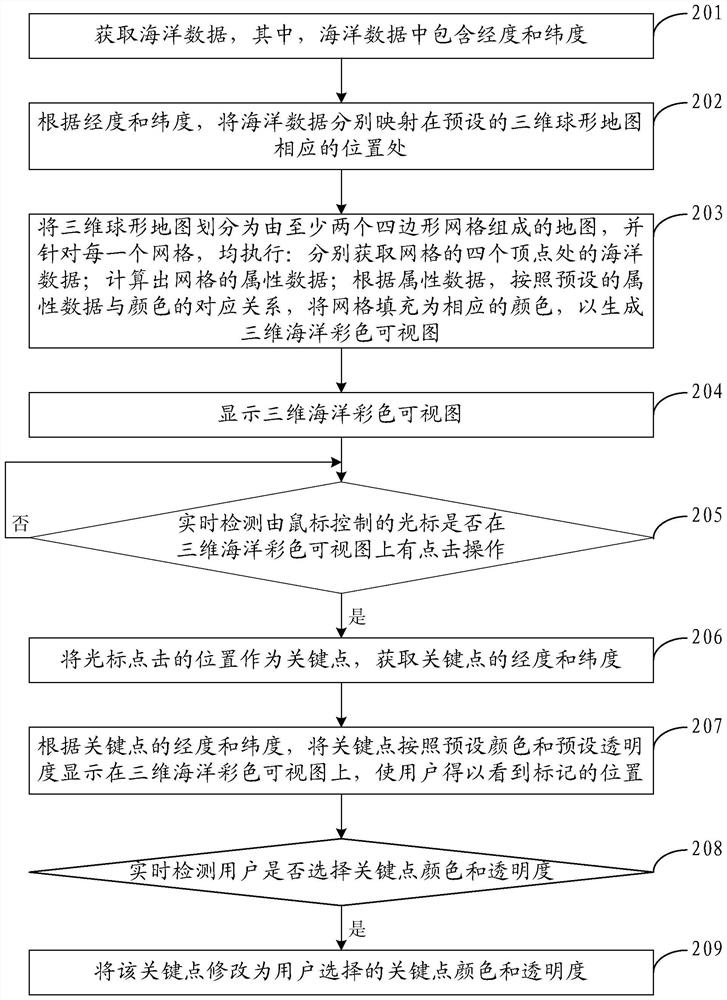
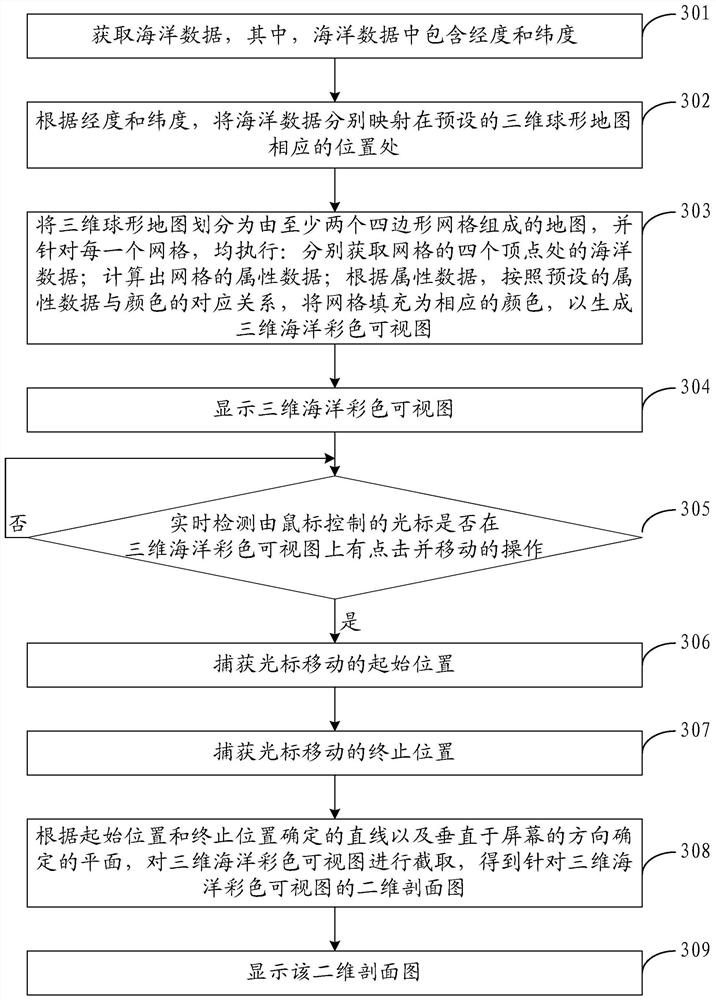
[0063] With the improvement of the strategic position of the ocean, the analysis of ocean data is becoming more and more important. At present, the analysis of ocean data can show the useful information contained in ocean data through visualization. However, the visualization processing of marine data in the prior art is mainly to generate statistical ch...


PUM


Abstract

The invention provides an ocean data visualization method and device. The method comprises the steps: obtaining ocean data which comprises longitude and latitude; according to the longitude and the latitude, respectively mapping the ocean data to corresponding positions of a preset three-dimensional spherical map; dividing the three-dimensional spherical map into a map consisting of at least two quadrilateral grids, and executing the following steps for each grid: respectively acquiring ocean data at four vertexes of the grid; calculating attribute data of the grids; filling the grids with corresponding colors according to the attribute data and a preset corresponding relationship between the attribute data and the colors so as to generate a three-dimensional ocean color view; and displaying the three-dimensional ocean color views. According to the scheme, the ocean data can be displayed by using the three-dimensional image.

Description

technical field [0001] The invention relates to the field of computer technology, in particular to a method and device for visualizing ocean data. Background technique [0002] With the development of remote sensing technology, the ocean data obtained by observing the ocean are becoming more and more precise, including the temperature, salinity, chlorophyll content and flow velocity of seawater, etc. Through the analysis of these ocean data, the physical properties of the ocean can be studied, and the changing process and changing law of ocean activities can be analyzed. [0003] At present, the analysis of ocean data can show the useful information contained in ocean data through visualization. However, in the prior art, the visualization processing of marine data is mainly to generate statistical charts for various types of features in the marine data, and it is impossible to display the marine data to users with three-dimensional images. Contents of the invention [0...

Claims


Application Information

Patent Timeline
Patent Type & Authority Applications(China)
IPC IPC(8): G06F16/29G06T17/05G06T17/20
CPCG06F16/29G06T17/05G06T17/20Y02A90/10
Inventor 路哲坤
Owner INSPUR COMMON SOFTWARE
Why Eureka
Try Eureka