An adaptive soft sensing method and system based on vine copula quantile regression

A quantile regression, soft measurement technology, applied in adaptive control, general control system, control/regulation system, etc., can solve problems such as large model error, improve practicability, good regression prediction ability, and avoid information loss Effect

Active Publication Date: 2022-08-09
EAST CHINA UNIV OF SCI & TECH
View PDF4 Cites 0 Cited by
  • Summary
  • Abstract
  • Description
  • Claims
  • Application Information

AI Technical Summary

Problems solved by technology

However, when there is heteroscedasticity in the process data, the model error is large

Method used


Image

  • An adaptive soft sensing method and system based on vine copula quantile regression
  • An adaptive soft sensing method and system based on vine copula quantile regression
  • An adaptive soft sensing method and system based on vine copula quantile regression

Examples


Embodiment 1

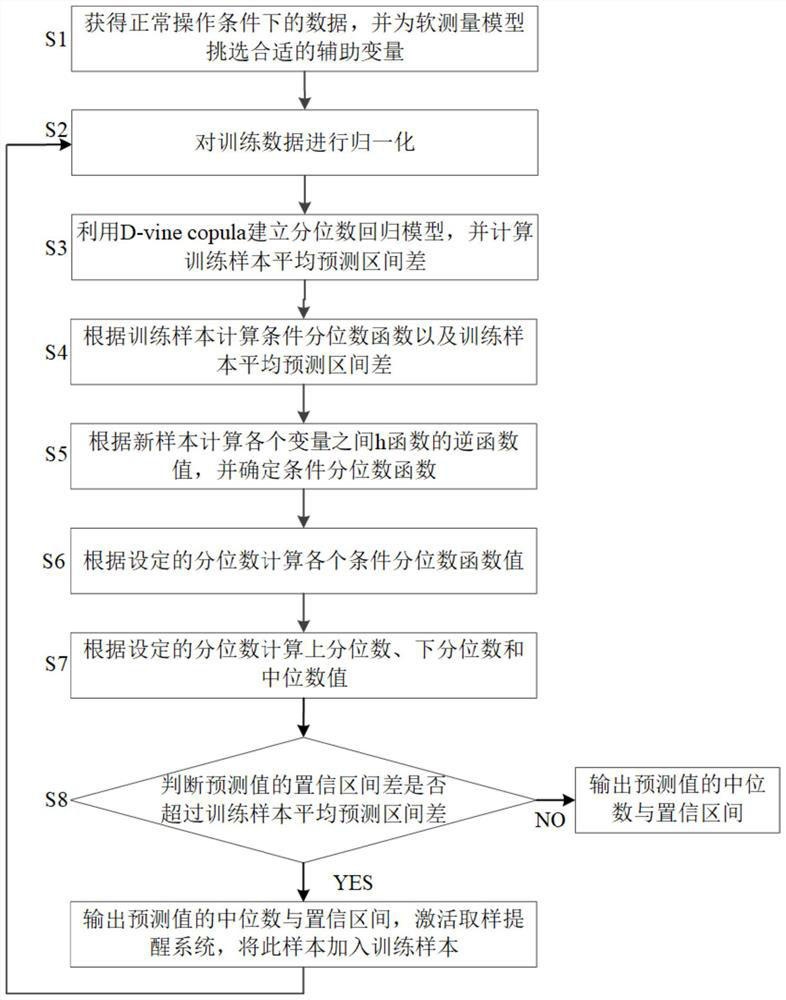
[0134] The invention discloses an adaptive soft measurement method based on vine copula quantile regression, and the specific steps are as follows:

[0135] [Step S1]: According to the actual industrial production situation and expert knowledge, obtain data under normal operating conditions, and select appropriate auxiliary variables for the soft sensing model;

[0136] [Step S2]: Normalize the training data to obtain data that can be used for copula modeling. To normalize the data, see equation (15)

[0137]

[0138] where X i is the variable before transformation, X i ' is the zero-mean standardized variable, mean(X i ) is the variable X i The mean of , sd(X i ) is the variable X i The standard deviation of , m is the dimension of the vector X.

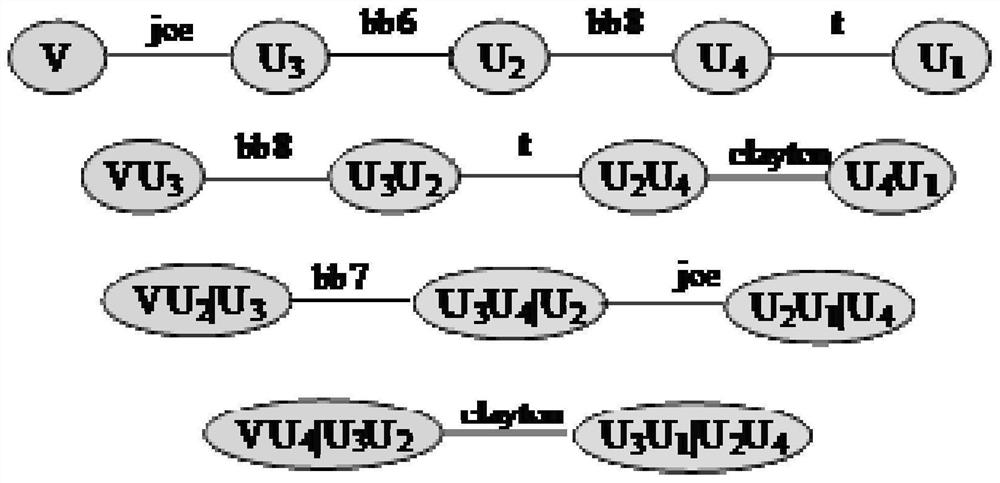
[0139] [Step S3]: Use D-vine copula to establish a quantile regression model.

[0140] Step 3.1: Formula (16) constructs the analytical model of D-vine copula:

[0141]

[0142] (F(X j |X j+1 ,…,X j+i-1 ),F(X j+i ...

Embodiment 2

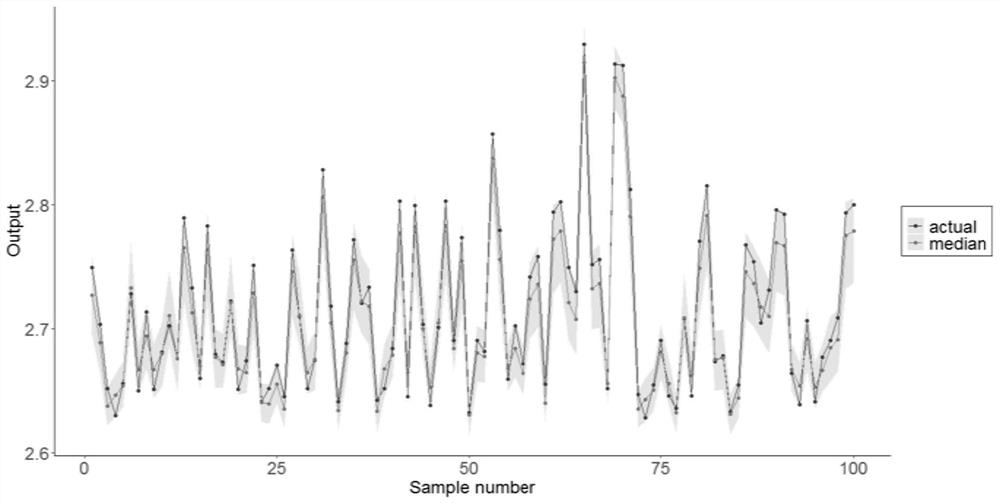
[0184] The following examples will help to understand the present invention, but do not limit the content of the present invention. see figure 2 , this embodiment realizes the prediction of the numerical instance, and the data of this embodiment is generated according to formula (25).

[0185] x i ~N(0,1)i=1,2

[0186]

[0187] x 4 =sin(x 2 +1)+x 2 x 3

[0188]

[0189] And the error e~N(0,0.01) is added to each dimension data. The prediction target is y. A total of 500 sets of data are selected, 400 sets are used for training the copula model, and 100 sets are used for testing.

[0190] (1) According to the prior information, four auxiliary variables are selected as x in formula (24). 1 ,x 2 ,x 3 ,x 4 , the key variable is y. (2) Data preprocessing: normalize the zero mean of the training samples to obtain the transformed data as [V, U 1 , U 2 , U 3 , U 4 ]. where V represents the normalized key variable, U 1 , U 2 , U 3 , U 4 stands for auxiliary...

Embodiment 3

[0203] see Figure 4 , This example realizes the prediction (PER) of the ethylene cracking degree in the ethylene cracking process. The data of this example comes from the SRT-III model ethylene cracking furnace. 500 sets of data under normal conditions were selected, 400 sets were used to train the copula model, and 100 sets were used for testing.

[0204] (1) According to the prior information, four auxiliary variables are selected: the average outlet temperature of the cracking furnace x 1 , the density of the pyrolysis feedstock x 2 , total feed x 3 and steam hydrocarbon ratio x 4 . The key variable y is the cracking depth indicator PER.

[0205] (2) Data preprocessing: normalize the zero mean of the training samples to obtain the transformed data [V, U 1 , U 2 , U 3 , U 4 ].

[0206] (3) Using the training samples [V, U 1 , U 2 , U 3 , U 4 ] Build the D-vine copula.

[0207] (4) Establish a quantile regression model, calculate the inverse function value of ...


PUM


Abstract

The present invention provides an adaptive soft measurement method and system based on vine copula quantile regression. The steps are as follows: obtaining data under normal operating conditions, selecting appropriate auxiliary variables; normalizing training data; using D‑vine copula establishes a quantile regression model; calculates the conditional quantile function and the average prediction interval difference of the training sample according to the training sample; collects and standardizes the auxiliary variables of the sample to be predicted online; determines the conditional quantile function; according to the set quantile Calculate each conditional quantile function value; denormalize the conditional quantile function value, and then obtain the median and confidence interval of the final predicted value; calculate the confidence interval difference of the predicted value, and compare whether the confidence interval difference of the predicted value is The average prediction interval difference over the training sample.

Description

technical field [0001] The invention belongs to the technical field of process control, and in particular relates to an adaptive soft measurement method based on vine copula quantile regression; meanwhile, the invention also relates to an adaptive soft measurement system based on vine copula quantile regression. Background technique [0002] As the scale of production in modern industry has grown larger, the production process has also become more complex. In order to ensure the normal and orderly operation of the production process of the factory, workers can monitor the system status in time, which is very important for the measurement and control of product quality. Due to the limitations of technology and technology, it is difficult to perform real-time online detection through hardware sensors. In the actual production process, manual offline analysis is usually used, that is, sampling every few hours and sending it to the laboratory for manual analysis. However, the m...

Claims


Application Information

Patent Timeline
Patent Type & Authority Patents(China)
IPC IPC(8): G05B13/04
CPCG05B13/042Y02P90/02
Inventor 李绍军倪佳能周洋刘漫丹贾琼田一彤李雪梅王世豪
Owner EAST CHINA UNIV OF SCI & TECH
Why Eureka
Try Eureka