High-dimensional data visualization method based on probability multi-level graph structure

A technology of high-dimensional data and graph structure, applied in the fields of instrument, character and pattern recognition, integrated learning, etc., can solve the problems of time-consuming optimization process, unsatisfactory visualization effect, difficult to handle large-scale data, etc., and achieve a good algorithm. Effects of complexity, beautiful visualizations

Active Publication Date: 2021-01-01
ZHEJIANG UNIV
View PDF11 Cites 0 Cited by
  • Summary
  • Abstract
  • Description
  • Claims
  • Application Information

AI Technical Summary

Problems solved by technology

[0004] The t-SNE algorithm is often used to visualize high-dimensional data with an inherently nonlinear structure. However, t-SNE is difficult to deal with growing large-scale data due to the quadratic relationship between the computational complexity and the number of data points.
Although BH-SNE, LargeVis and other algorithms obtain smaller algorithm complexity by constructing the nearest neighbor network and negative sampling technology, these methods still face two main problems when applied to large-scale data: 1) The visualization effect is often not enough to impress Satisfactory; 2) The optimization process is still time-consuming

Method used


Image

  • High-dimensional data visualization method based on probability multi-level graph structure
  • High-dimensional data visualization method based on probability multi-level graph structure
  • High-dimensional data visualization method based on probability multi-level graph structure

Examples


Embodiment

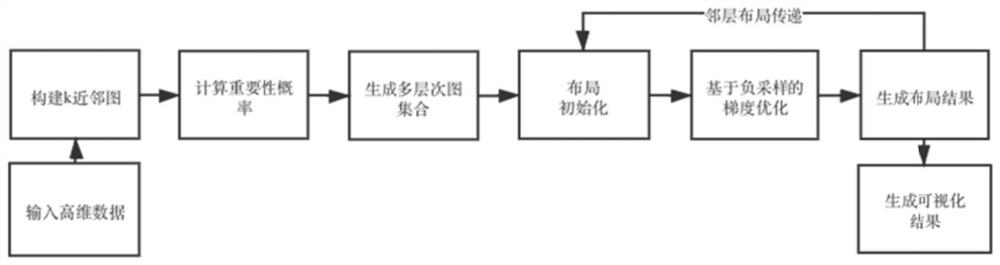
[0036] see figure 1 , the high-dimensional data visualization method based on the probabilistic multi-level graph structure of the present embodiment includes the following steps:

[0037]S100, given a high-dimensional data set X={x 1 , x 2 ,...,x N}, which contains n data points, and the dimension of each data point is D.

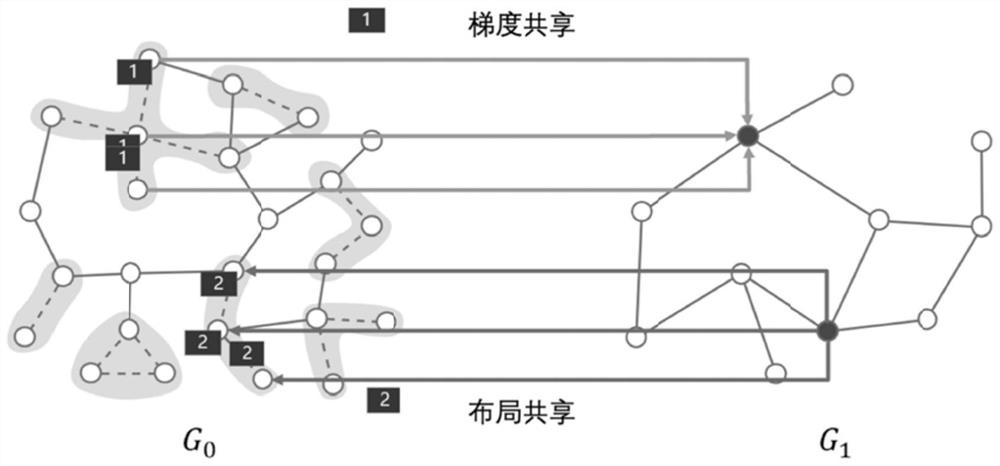
[0038] S200, calculate the k nearest neighbors of each data point based on step S100, and construct the nearest neighbor graph structure G 0 , based on the graph structure G 0 Construct a probabilistic multi-level structure to obtain a set of L-level graph structures

[0039] Among them, the construction process of the probabilistic multi-level graph set is:

[0040] S201. Construct multiple random k-d tree indexes based on data distribution. For each data point, the k-nearest neighbors are sequentially obtained on multiple k-d trees, and the neighborhood nodes of these nodes in the k-d tree space, and the k-nearest neighbors of each data point ar...


PUM


Abstract

The invention relates to a high-dimensional data visualization method based on a probability multi-level graph structure, and belongs to the technical field of data visualization and dimension reduction. The high-dimensional data visualization method comprises the steps of: (1) giving a high-dimensional data set, wherein the data set comprises n data points, and the dimension of each data point isD; 2) calculating k neighbors of each data point, constructing a nearest neighbor graph structure G0, and constructing a probability multi-level graph structure based on the graph structure G0 to obtain a probability multi-level graph structure set; 3) laying out probability multi-level graphs layer by layer based on the probability multi-level graph structure set to obtain data low-dimensional representation, wherein the dimension of each data point is two-dimensional or three-dimensional; and 4) constructing a scatter view based on the low-dimensional data for data mining and analysis. According to the high-dimensional data visualization method, an optimization calculation process is accelerated by utilizing a hierarchical graph structure, and a visualization effect is optimized by introducing probability-based sampling.

Description

technical field [0001] The invention relates to the technical field of data visualization and dimensionality reduction, in particular to a high-dimensional data visualization method based on a probabilistic multi-level graph structure. Background technique [0002] High-dimensional data visualization is an important task in data analysis, and plays a vital role in deep learning, life science and network analysis. Dimensionality reduction algorithms learn complex information in data, transform high-dimensional data into low-dimensional data, and analyze the distribution of data. [0003] Over the past few decades, a large number of visualization methods for high-dimensional data have been proposed. The t-SNE algorithm is one of the most successful dimensionality reduction algorithms. The invention patent application document with the publication number CN110458187A discloses a malicious code family clustering method and system, wherein the method includes using the T-SNE alg...

Claims


Application Information

Patent Timeline
Patent Type & Authority Applications(China)
IPC IPC(8): G06K9/62G06N20/20
CPCG06N20/20G06F18/24147G06F18/2415G06F18/214
Inventor 朱闽峰胡元哲陈为
Owner ZHEJIANG UNIV
Why Eureka
Try Eureka