
Analysis of massive data accumulations using patient rule induction method and on-line analytical processing

a technology of patient rule and analysis method, applied in data processing applications, instruments, data mining, etc., can solve the problems of inability to process and analyze such massive amounts of data, and inability to meet the needs of large-scale data collection

Inactive Publication Date: 2002-09-05
HITACHI LTD
View PDF0 Cites 26 Cited by
  • Summary
  • Abstract
  • Description
  • Claims
  • Application Information

AI Technical Summary

Benefits of technology

[0017] The unique combination of PRIM and a comparison tool, such as OLAP, enables efficient searching of records in the database to find patterns, then a detailed analysis on the subset of records defined by the patterns.

Problems solved by technology

Unfortunately, as capable as today's computing technology may be at gathering, organizing, and maintaining such large accumulations of data, they fail miserably at being able to process and analyze such massive amounts of data.
This inability to be able to unearth and pull relevant business insights, interesting patterns, and like observations from large quantities of data makes collecting such data less useful.
Even searching such databases and data warehouses for relevant relationships in an effort to gain some insight into and observations about buying patterns, for example, can be a daunting task due not only to the huge amounts data available for review and analysis, but also to the lack of capability available to today's search technology.
But, it is not intuitive or obvious as to how an analysis of such a large amount of data should be focused, what new knowledge should be extracted from the database, or how to then interpret and evaluate this new knowledge.
Lack of a key variable in a search can result in an output that may be incorrectly interpreted, or just undecipherable.
There are limitations to this integration approach.
These tools solve different types of problems so it is difficult to use them to support one another.
Also, these tools do not always present results in an easy to understand manner.
However, users may miss the meaning of the pattern or an explanation for its occurrence.
That is, a user cannot easily look at a SQL statement describing a PRIM region and intuitively understand the differences between the high average region and the other data points or outer region.
Some combinations of these tools do not make sense.
For example, OLAP tools cannot discover high average regions or find new patterns in data.

Method used


Image

  • Analysis of massive data accumulations using patient rule induction method and on-line analytical processing
  • Analysis of massive data accumulations using patient rule induction method and on-line analytical processing
  • Analysis of massive data accumulations using patient rule induction method and on-line analytical processing

Examples


Embodiment Construction

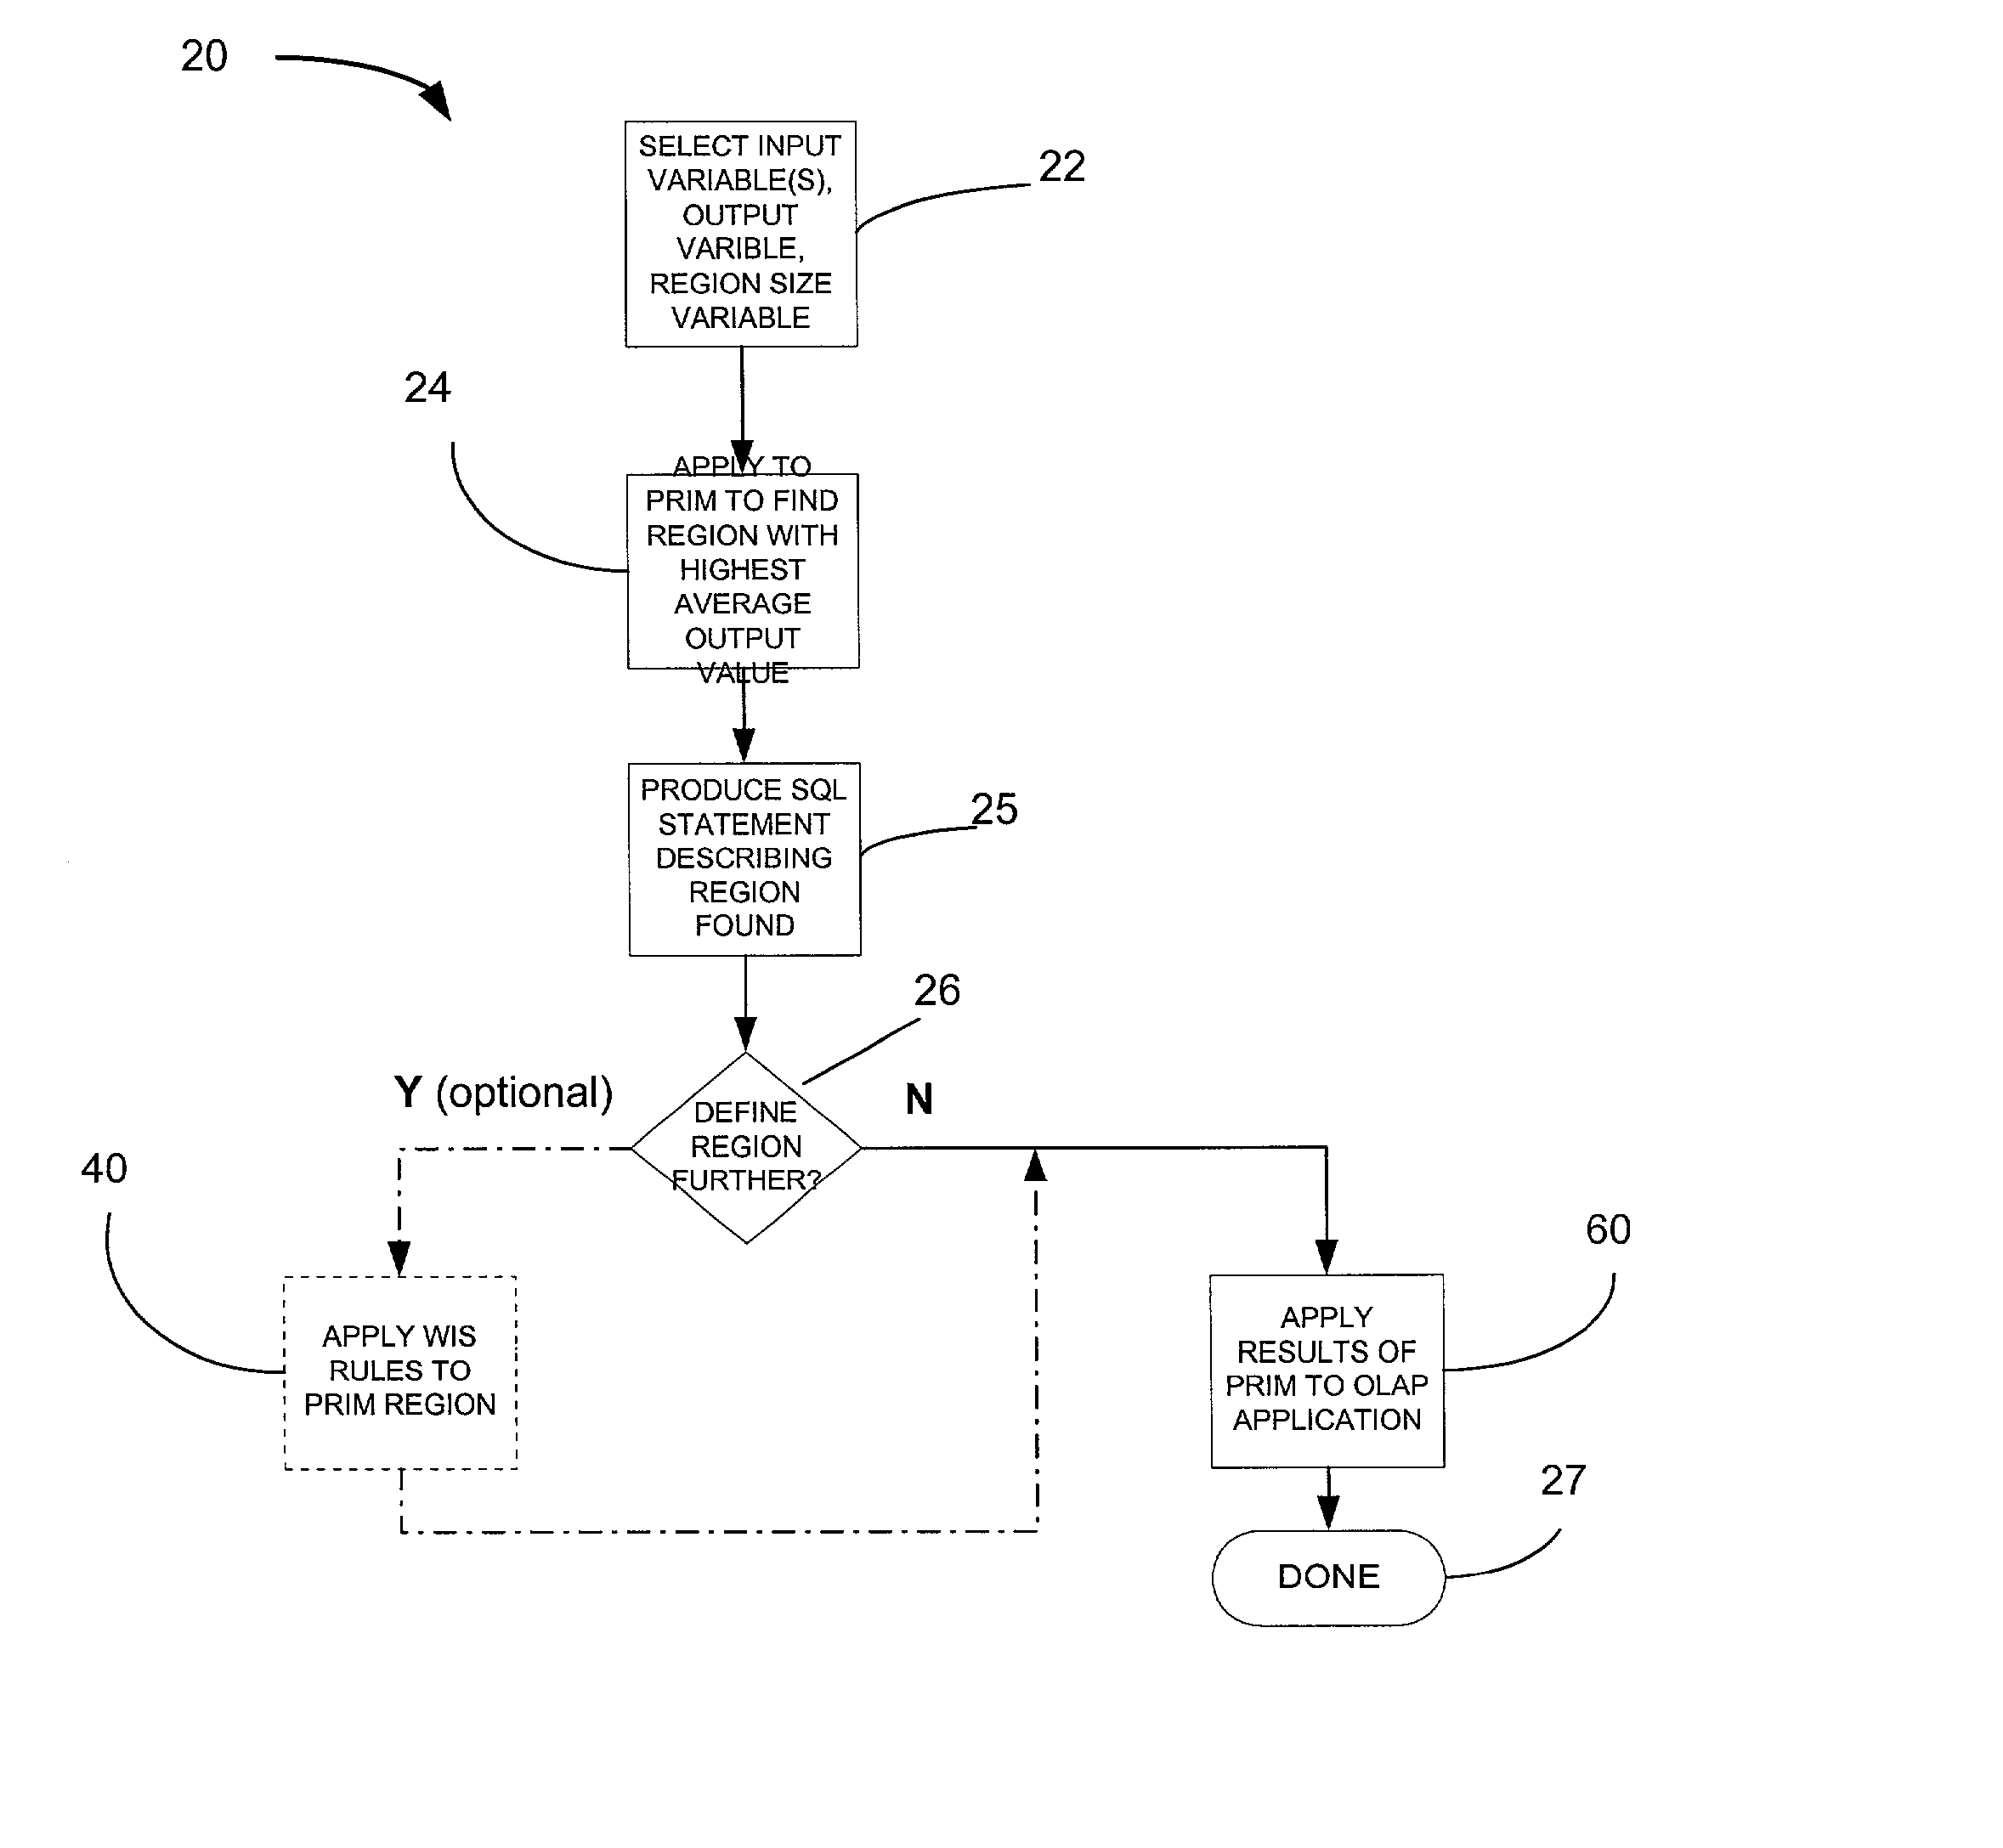
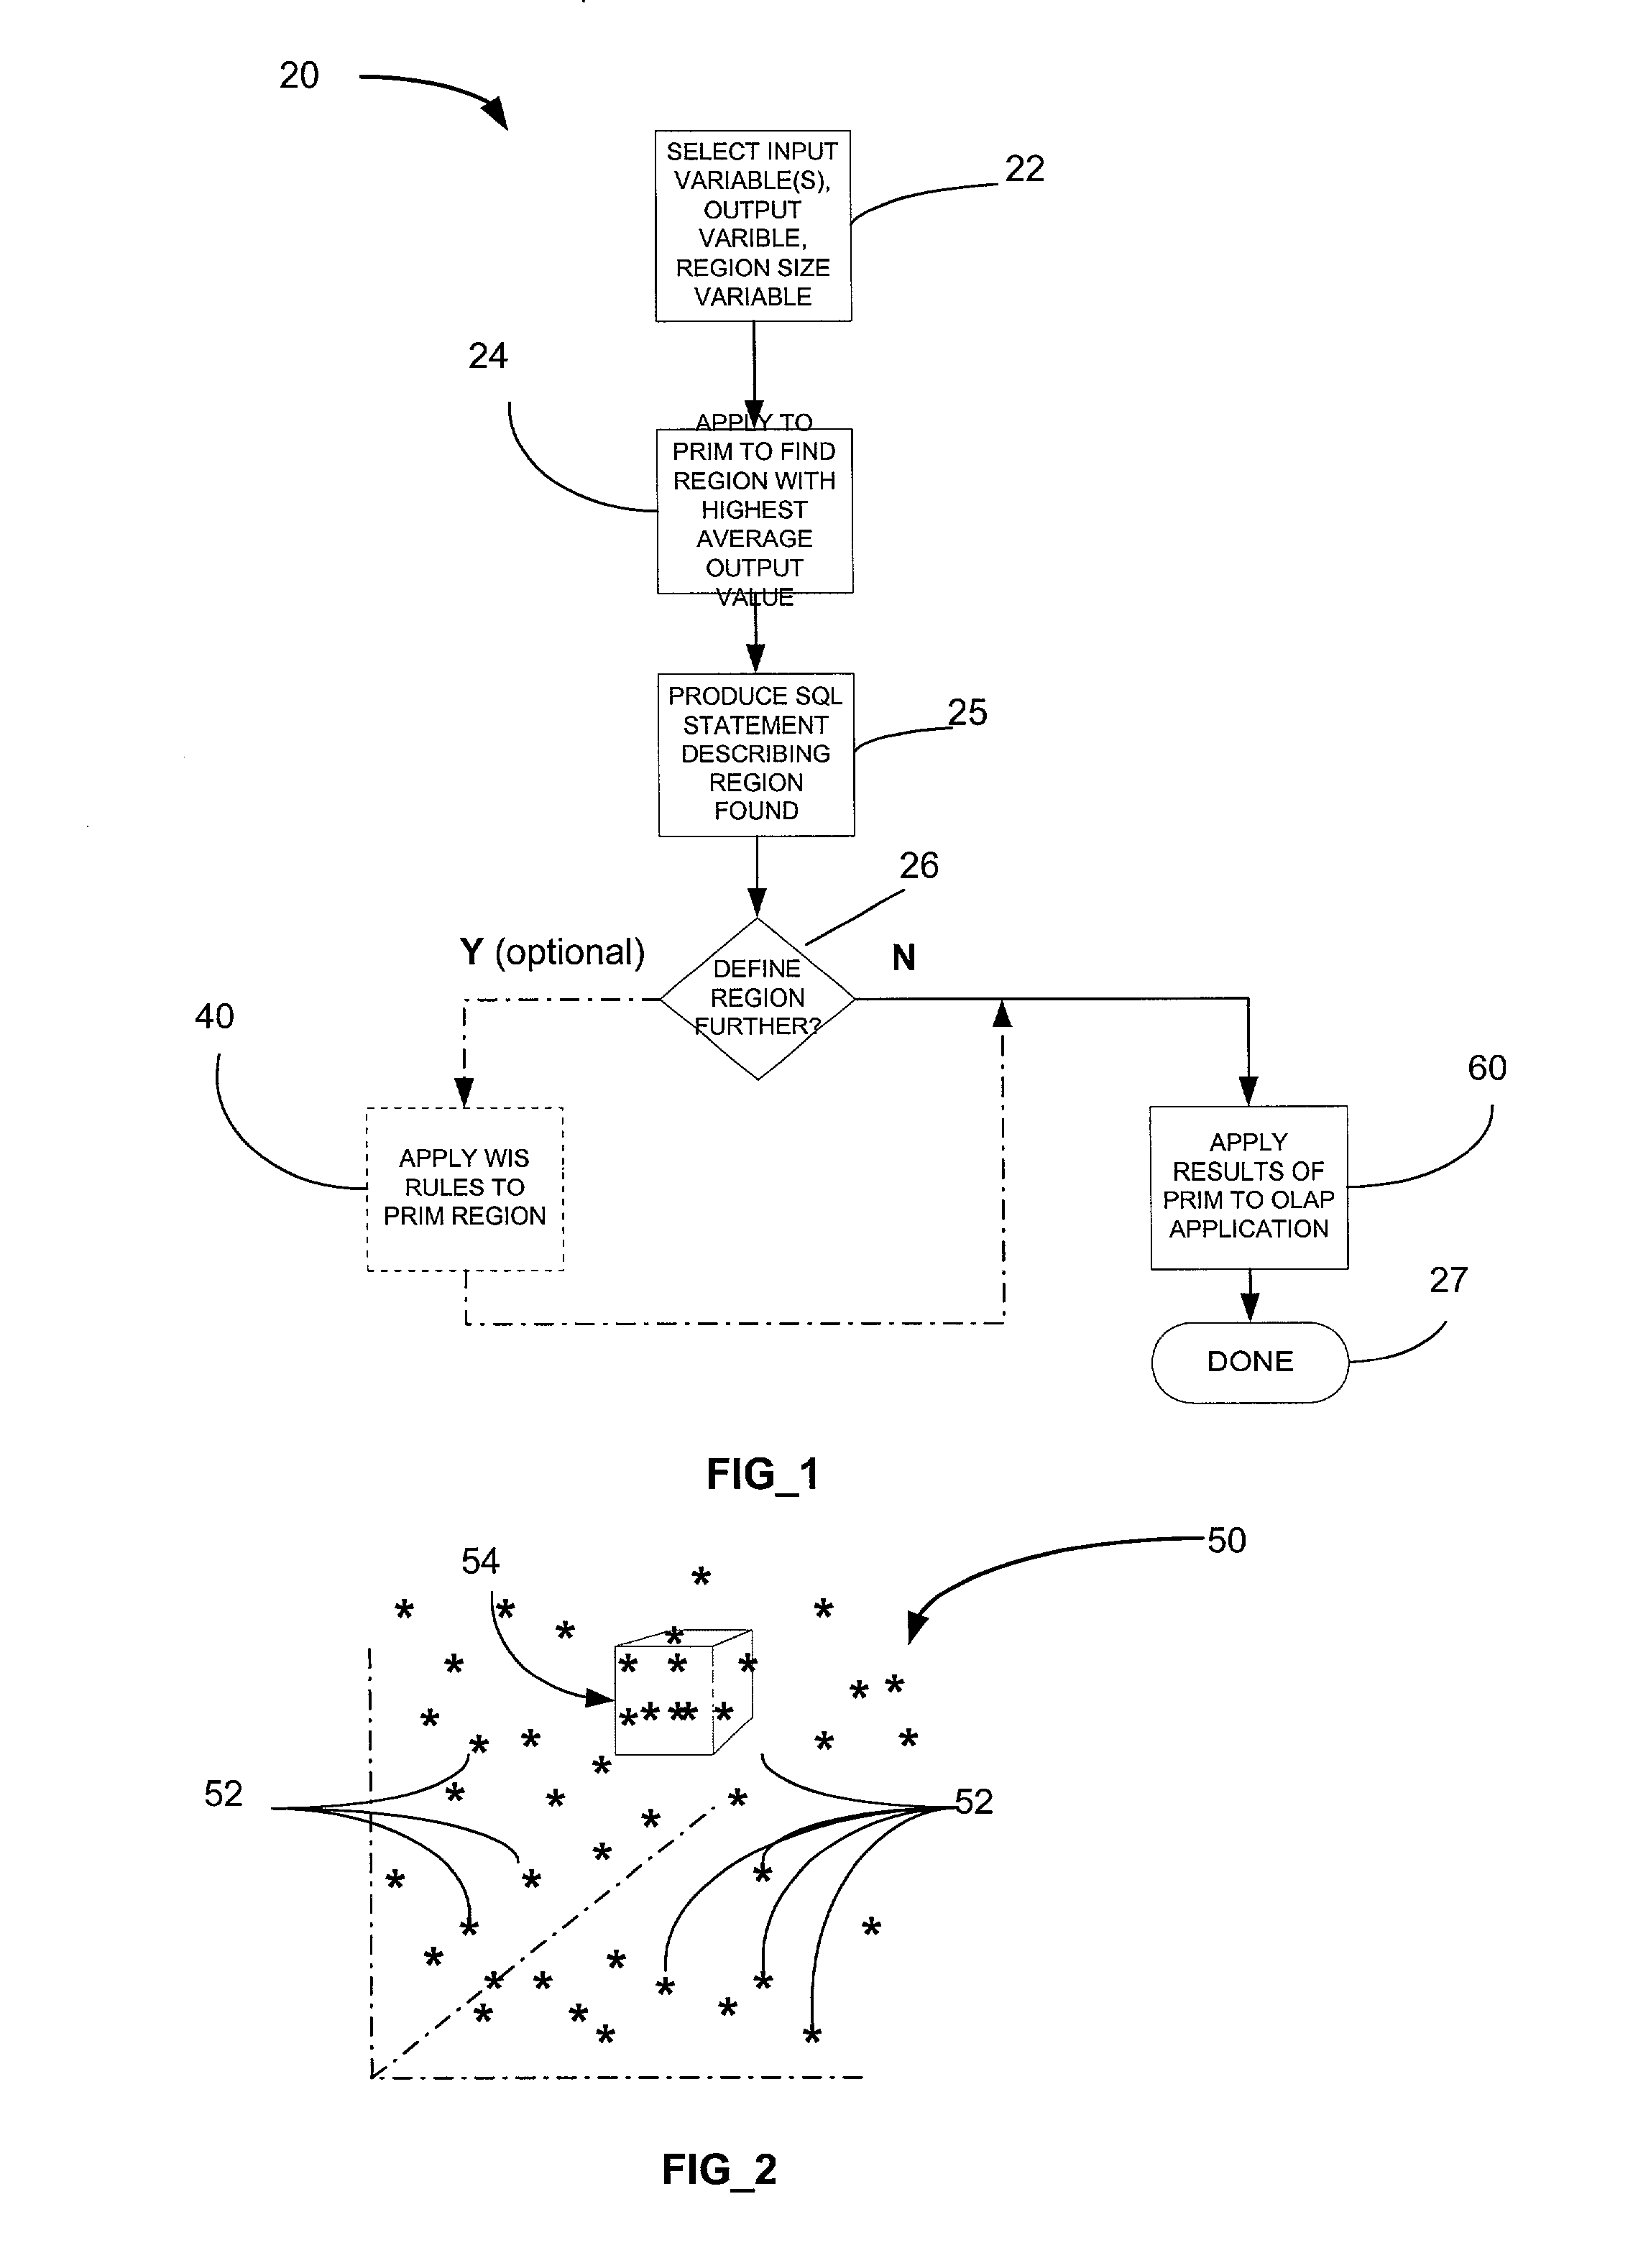
[0032] An overview of the invention is shown generally by the flow chart of FIG. 1, which broadly identifies the major steps of the invention. Generally, the method of the invention: or method has three steps:

[0033] 1) First find an interesting region, represented by facts / rules.

[0034] 2) Perform detailed analysis of the region using OLAP, including comparing subset of records with remaining records in the population. OLAP can be used to compare the highest average region and / or a sub-region.

[0035] 3) Perform a second detailed analysis on the region using OLAP, including comparing subset of records with the entire population of records. OLAP can be used to compare the highest average region and / or a sub-region.

[0036] The order of steps 2 and 3 is unimportant and either step is optional.

[0037] An optional step, following step 1, and before step 2, is to find interesting rules describing the region.

[0038] The following paragraphs walk through each of these four steps. Then a specific ...


PUM


Abstract

A method of analyzing data contained in a very large database or data warehouse includes applying first a patient rule induction method with selected input variables and an output variable to develop a region containing a subset of database records having a highest average output value. Then, the subset of records may be aggregated, sorted, compared, or new measures computed, preferably using an on line analytical processing function, for an pattern analysis of the subset records. An alternative is to apply a weighted item set function to the subset to produce a reduced subset, and then applying the reduced subset to on line analytical processing for pattern analysis.

Description

[0001] The present invention is directed to analysis, interpretation and comparison of data of large databases or data warehouse environments. Specifically, a major objective of the invention is to provide a method for automatically and efficiently interpreting such data.[0002] Recent years has seen a proliferation of data collection. Due in large part to the growth of use of computers in every facet of the business world, massive amounts of data can now be assembled and maintained in very large databases and data warehouses. (A data warehouse is collection of data designed to support management decision making together with a database system for maintaining the data, and systems for extracting desired portions of the data.) Unfortunately, as capable as today's computing technology may be at gathering, organizing, and maintaining such large accumulations of data, they fail miserably at being able to process and analyze such massive amounts of data. This inability to be able to unear...

Claims


Application Information

Patent Timeline
IPC IPC(8): G06F17/30
CPCG06F17/30539G06F2216/03Y10S707/99936G06F16/2465
Inventor SU, HUA-CHINGSAKATA, TAIKIHERMAN, CHARLESDOLINS, STEVEN
Owner HITACHI LTD
Learn More