This helps you quickly interpret patents by identifying the three key elements:
Problems solved by technology
Method used
Benefits of technology
Benefits of technology
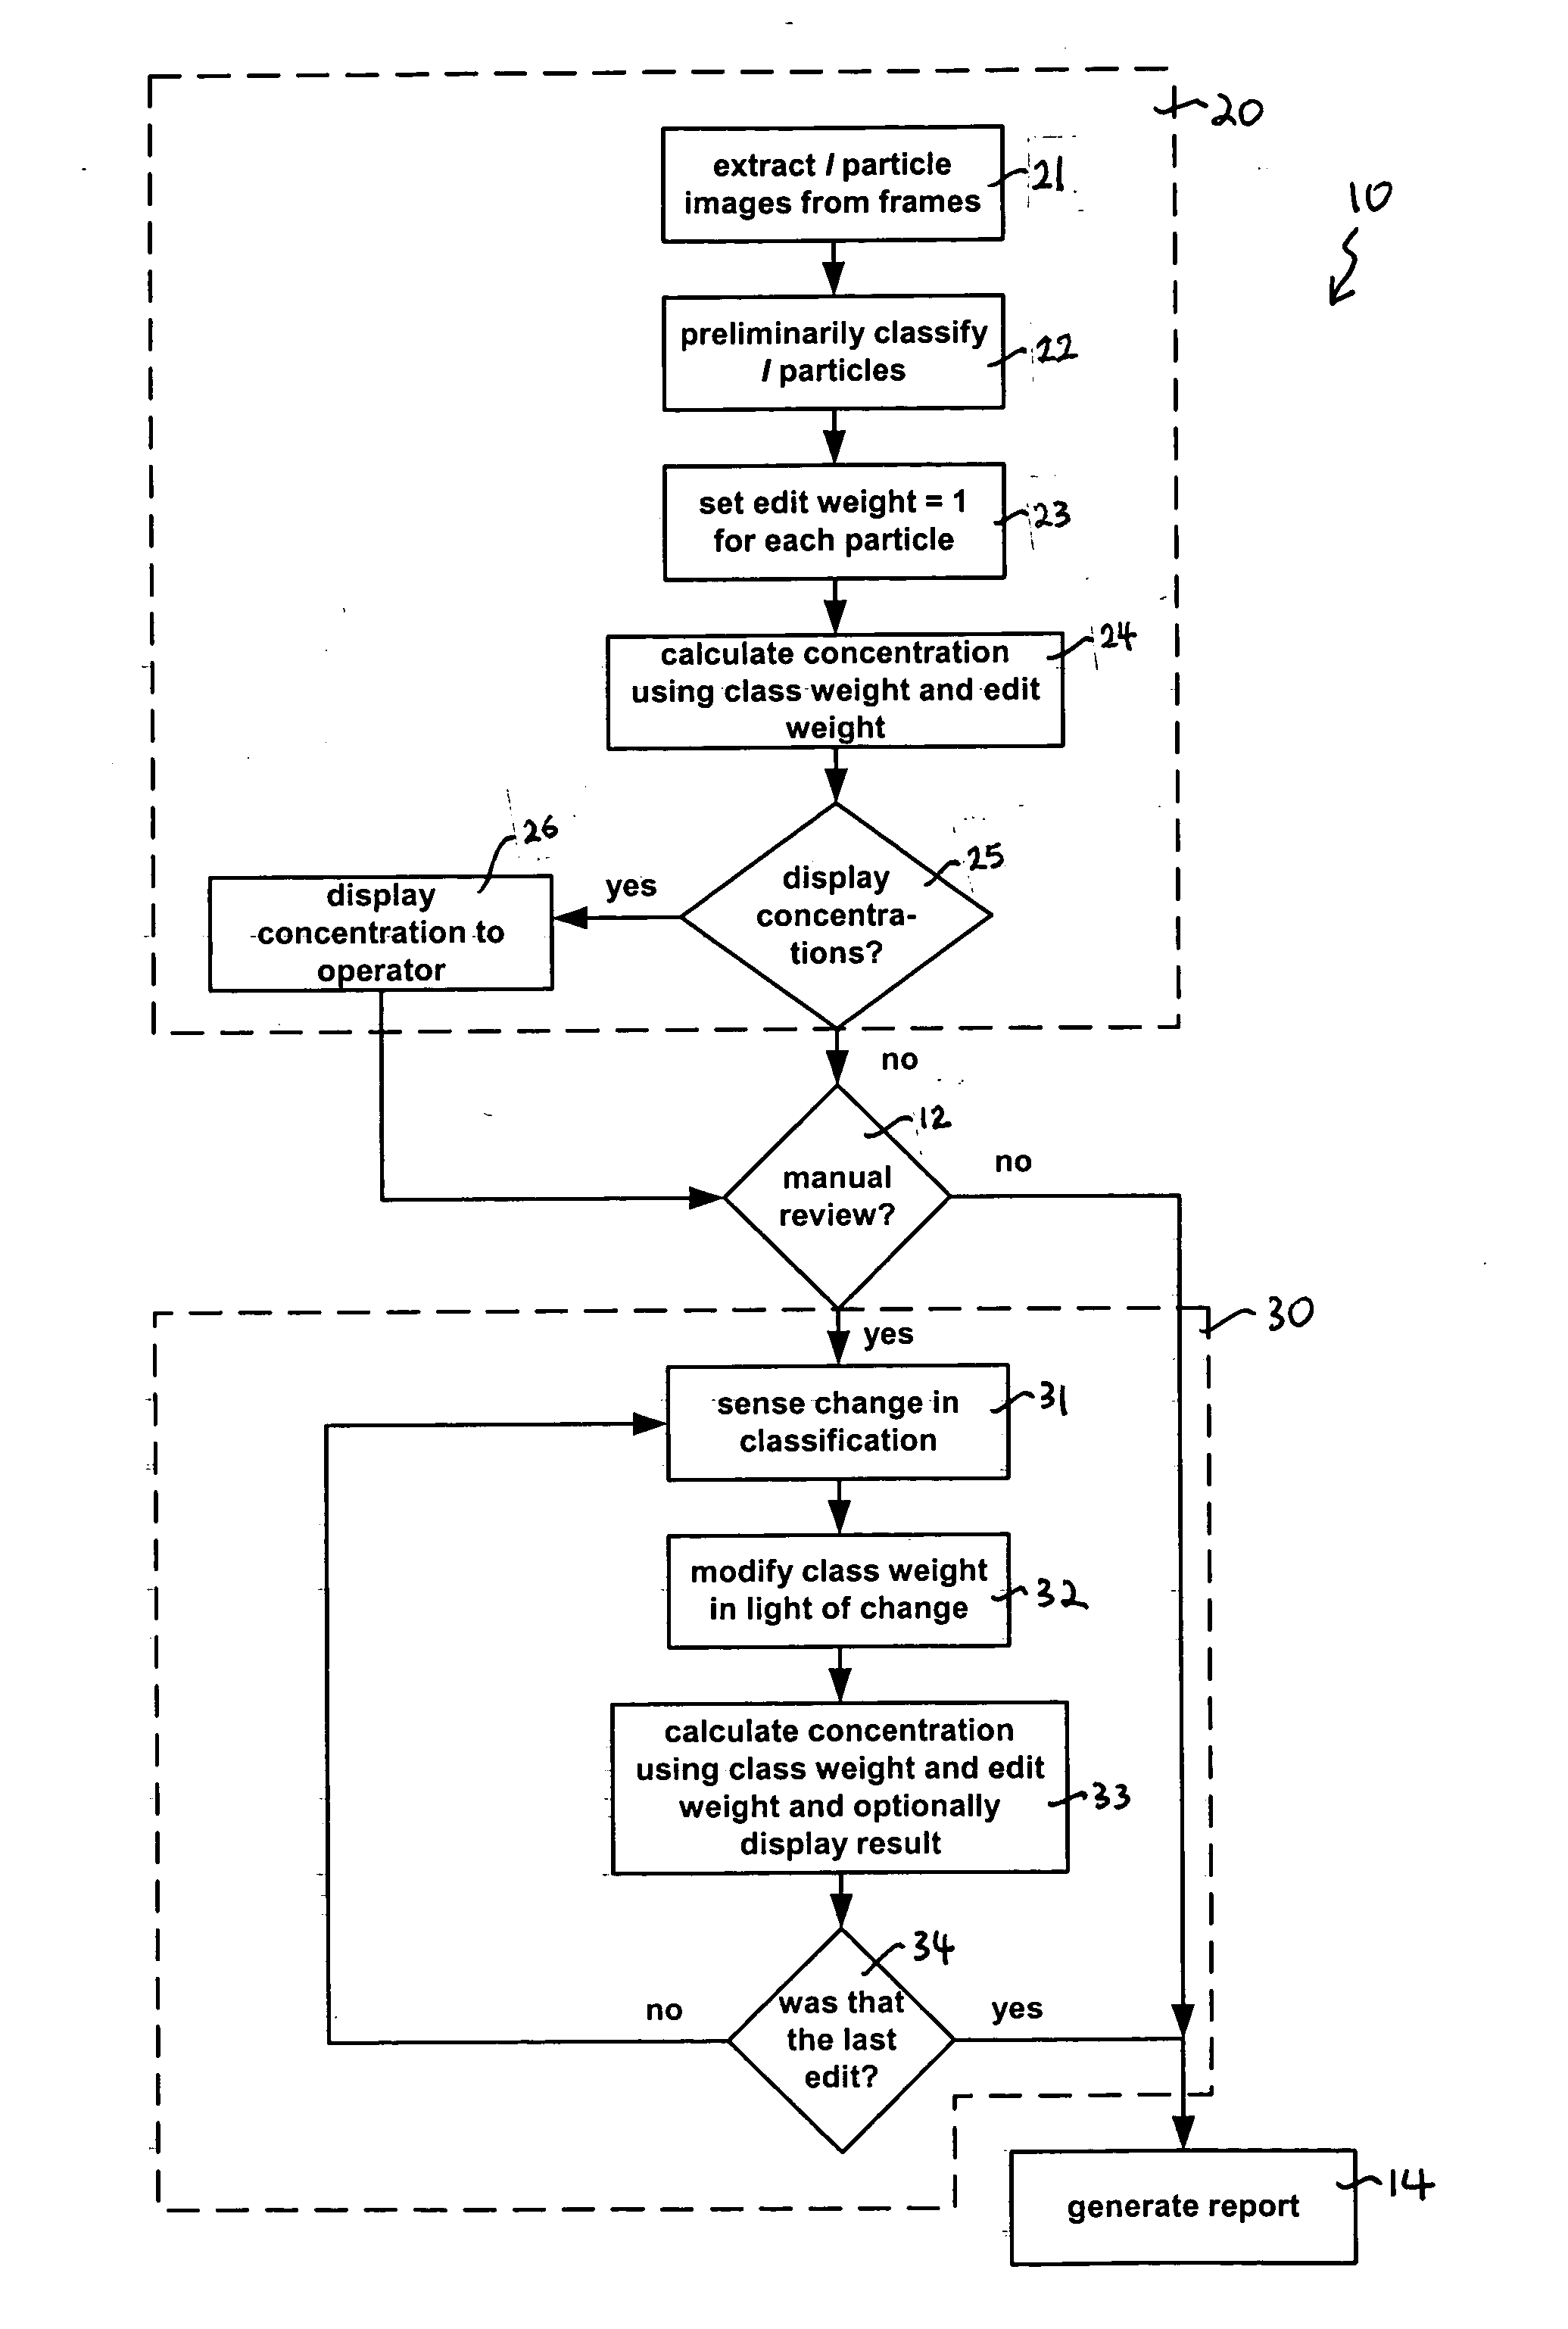
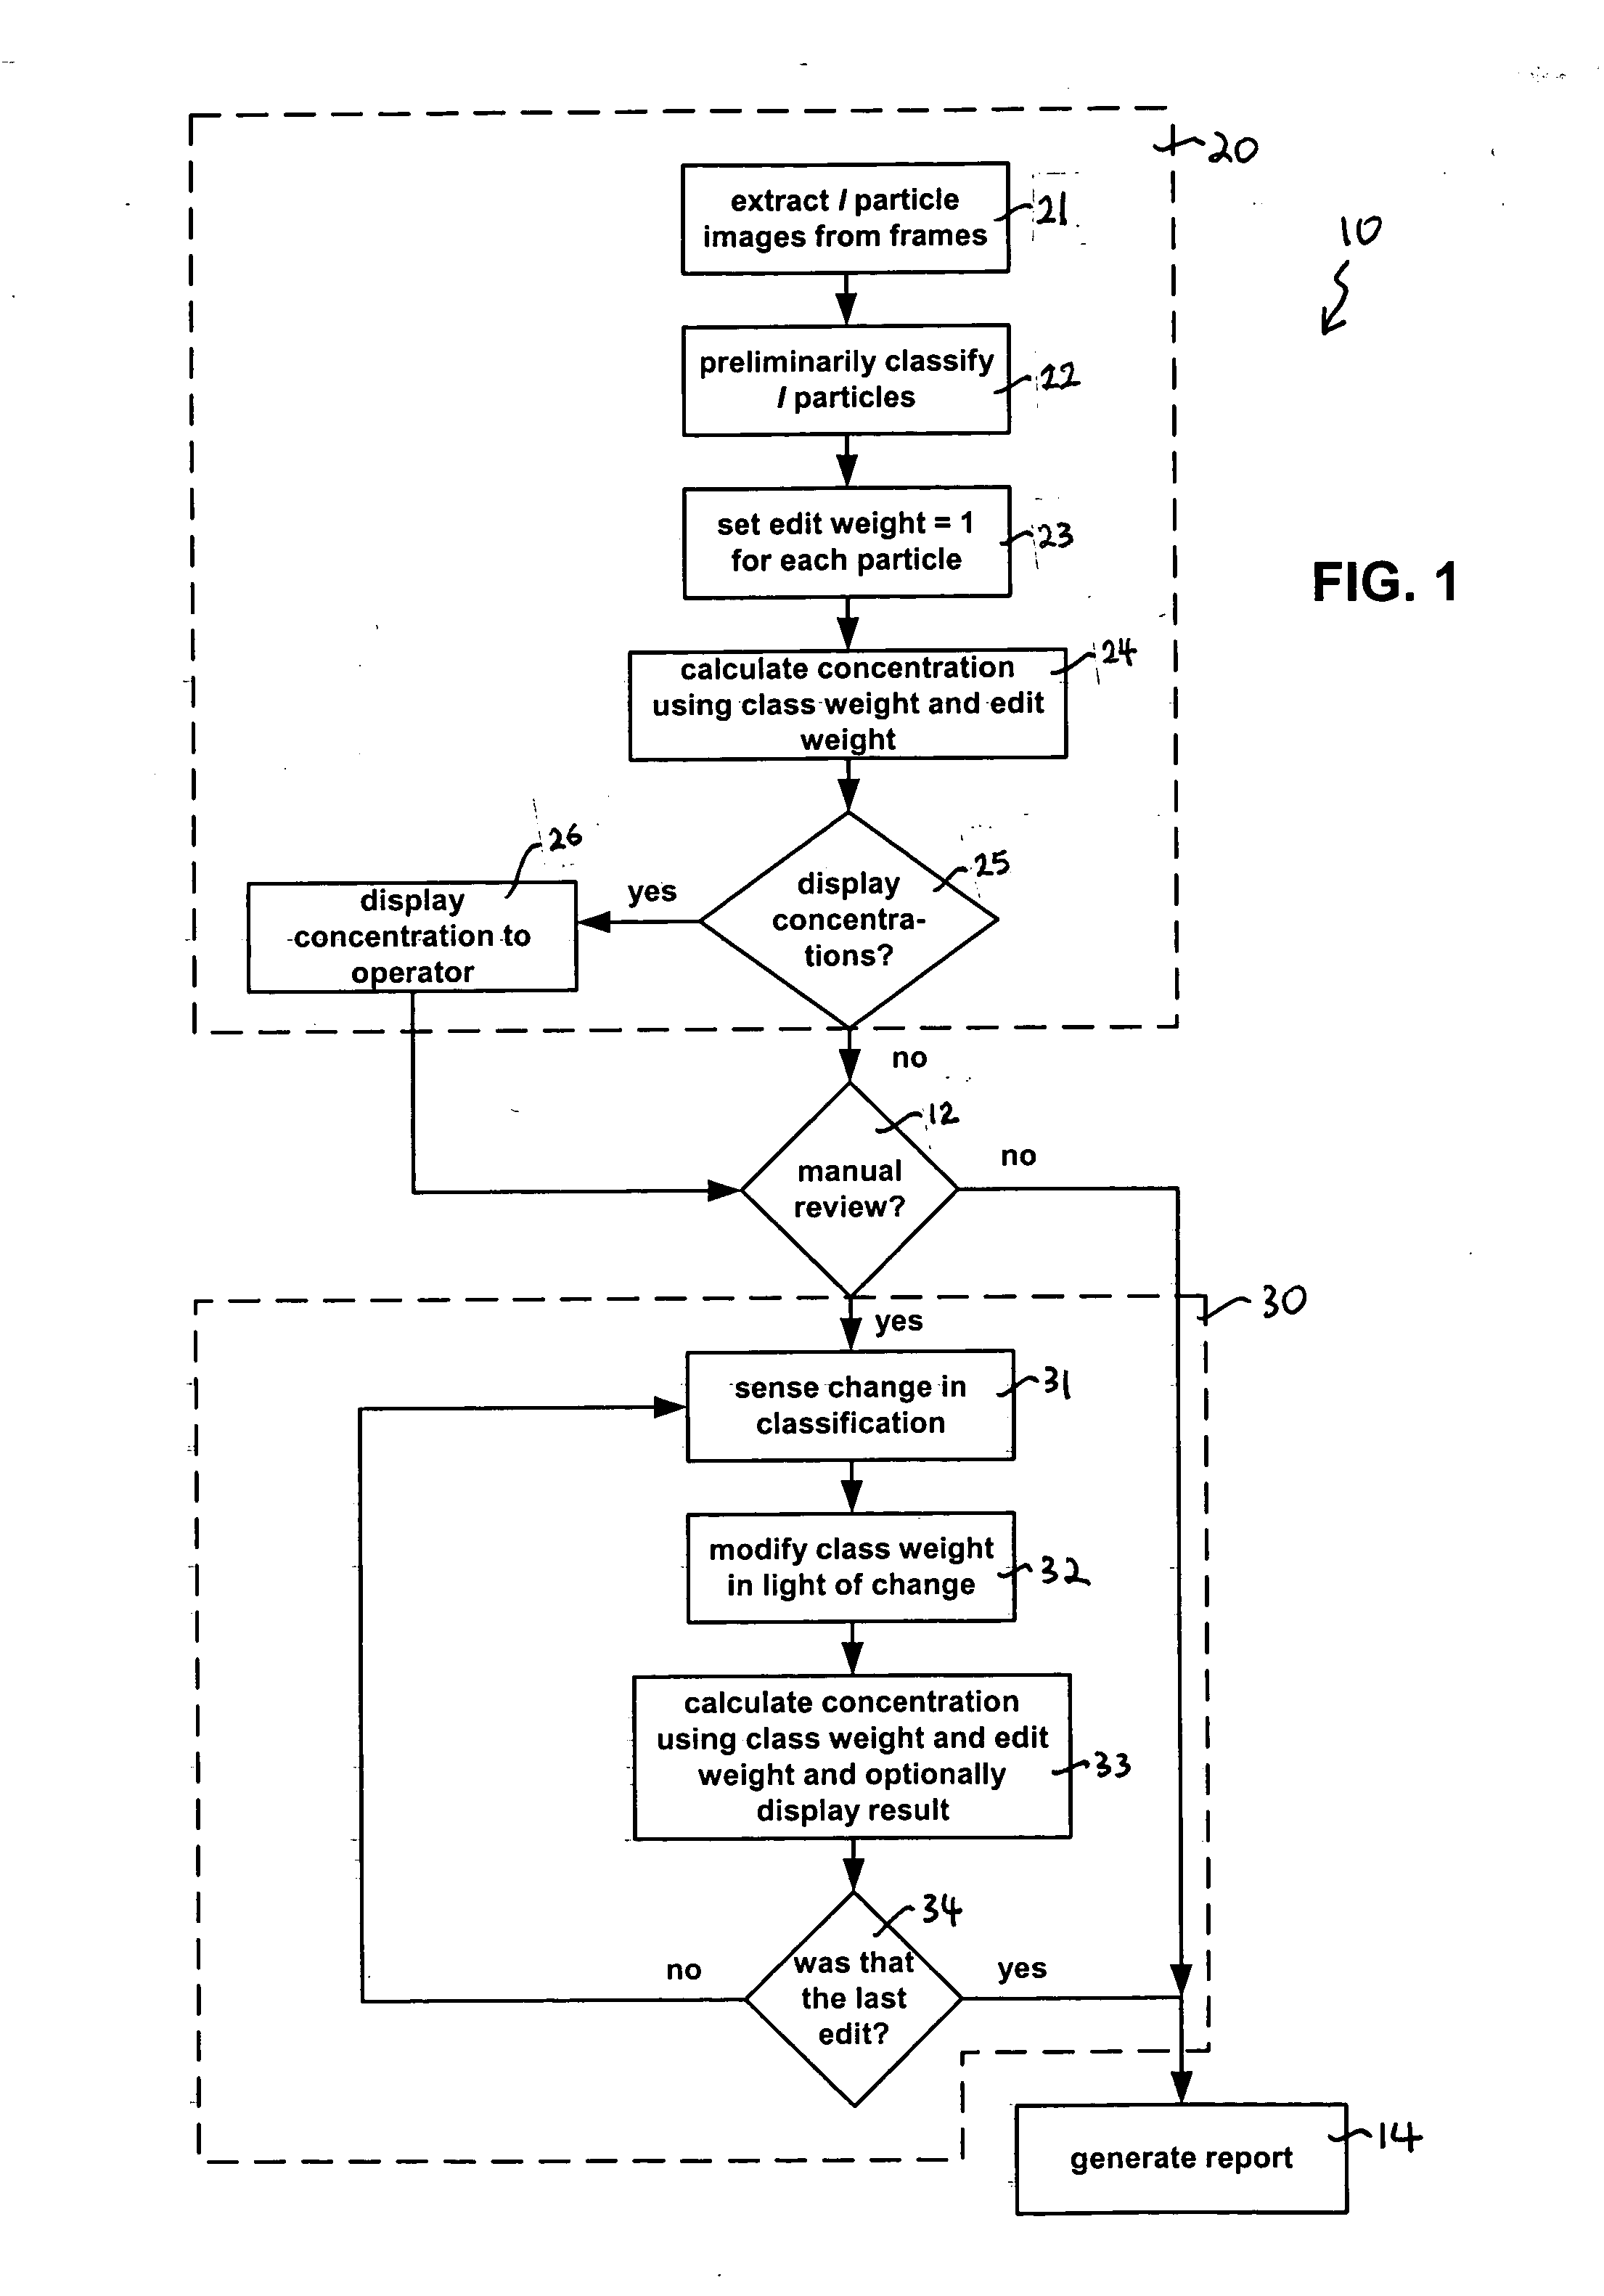
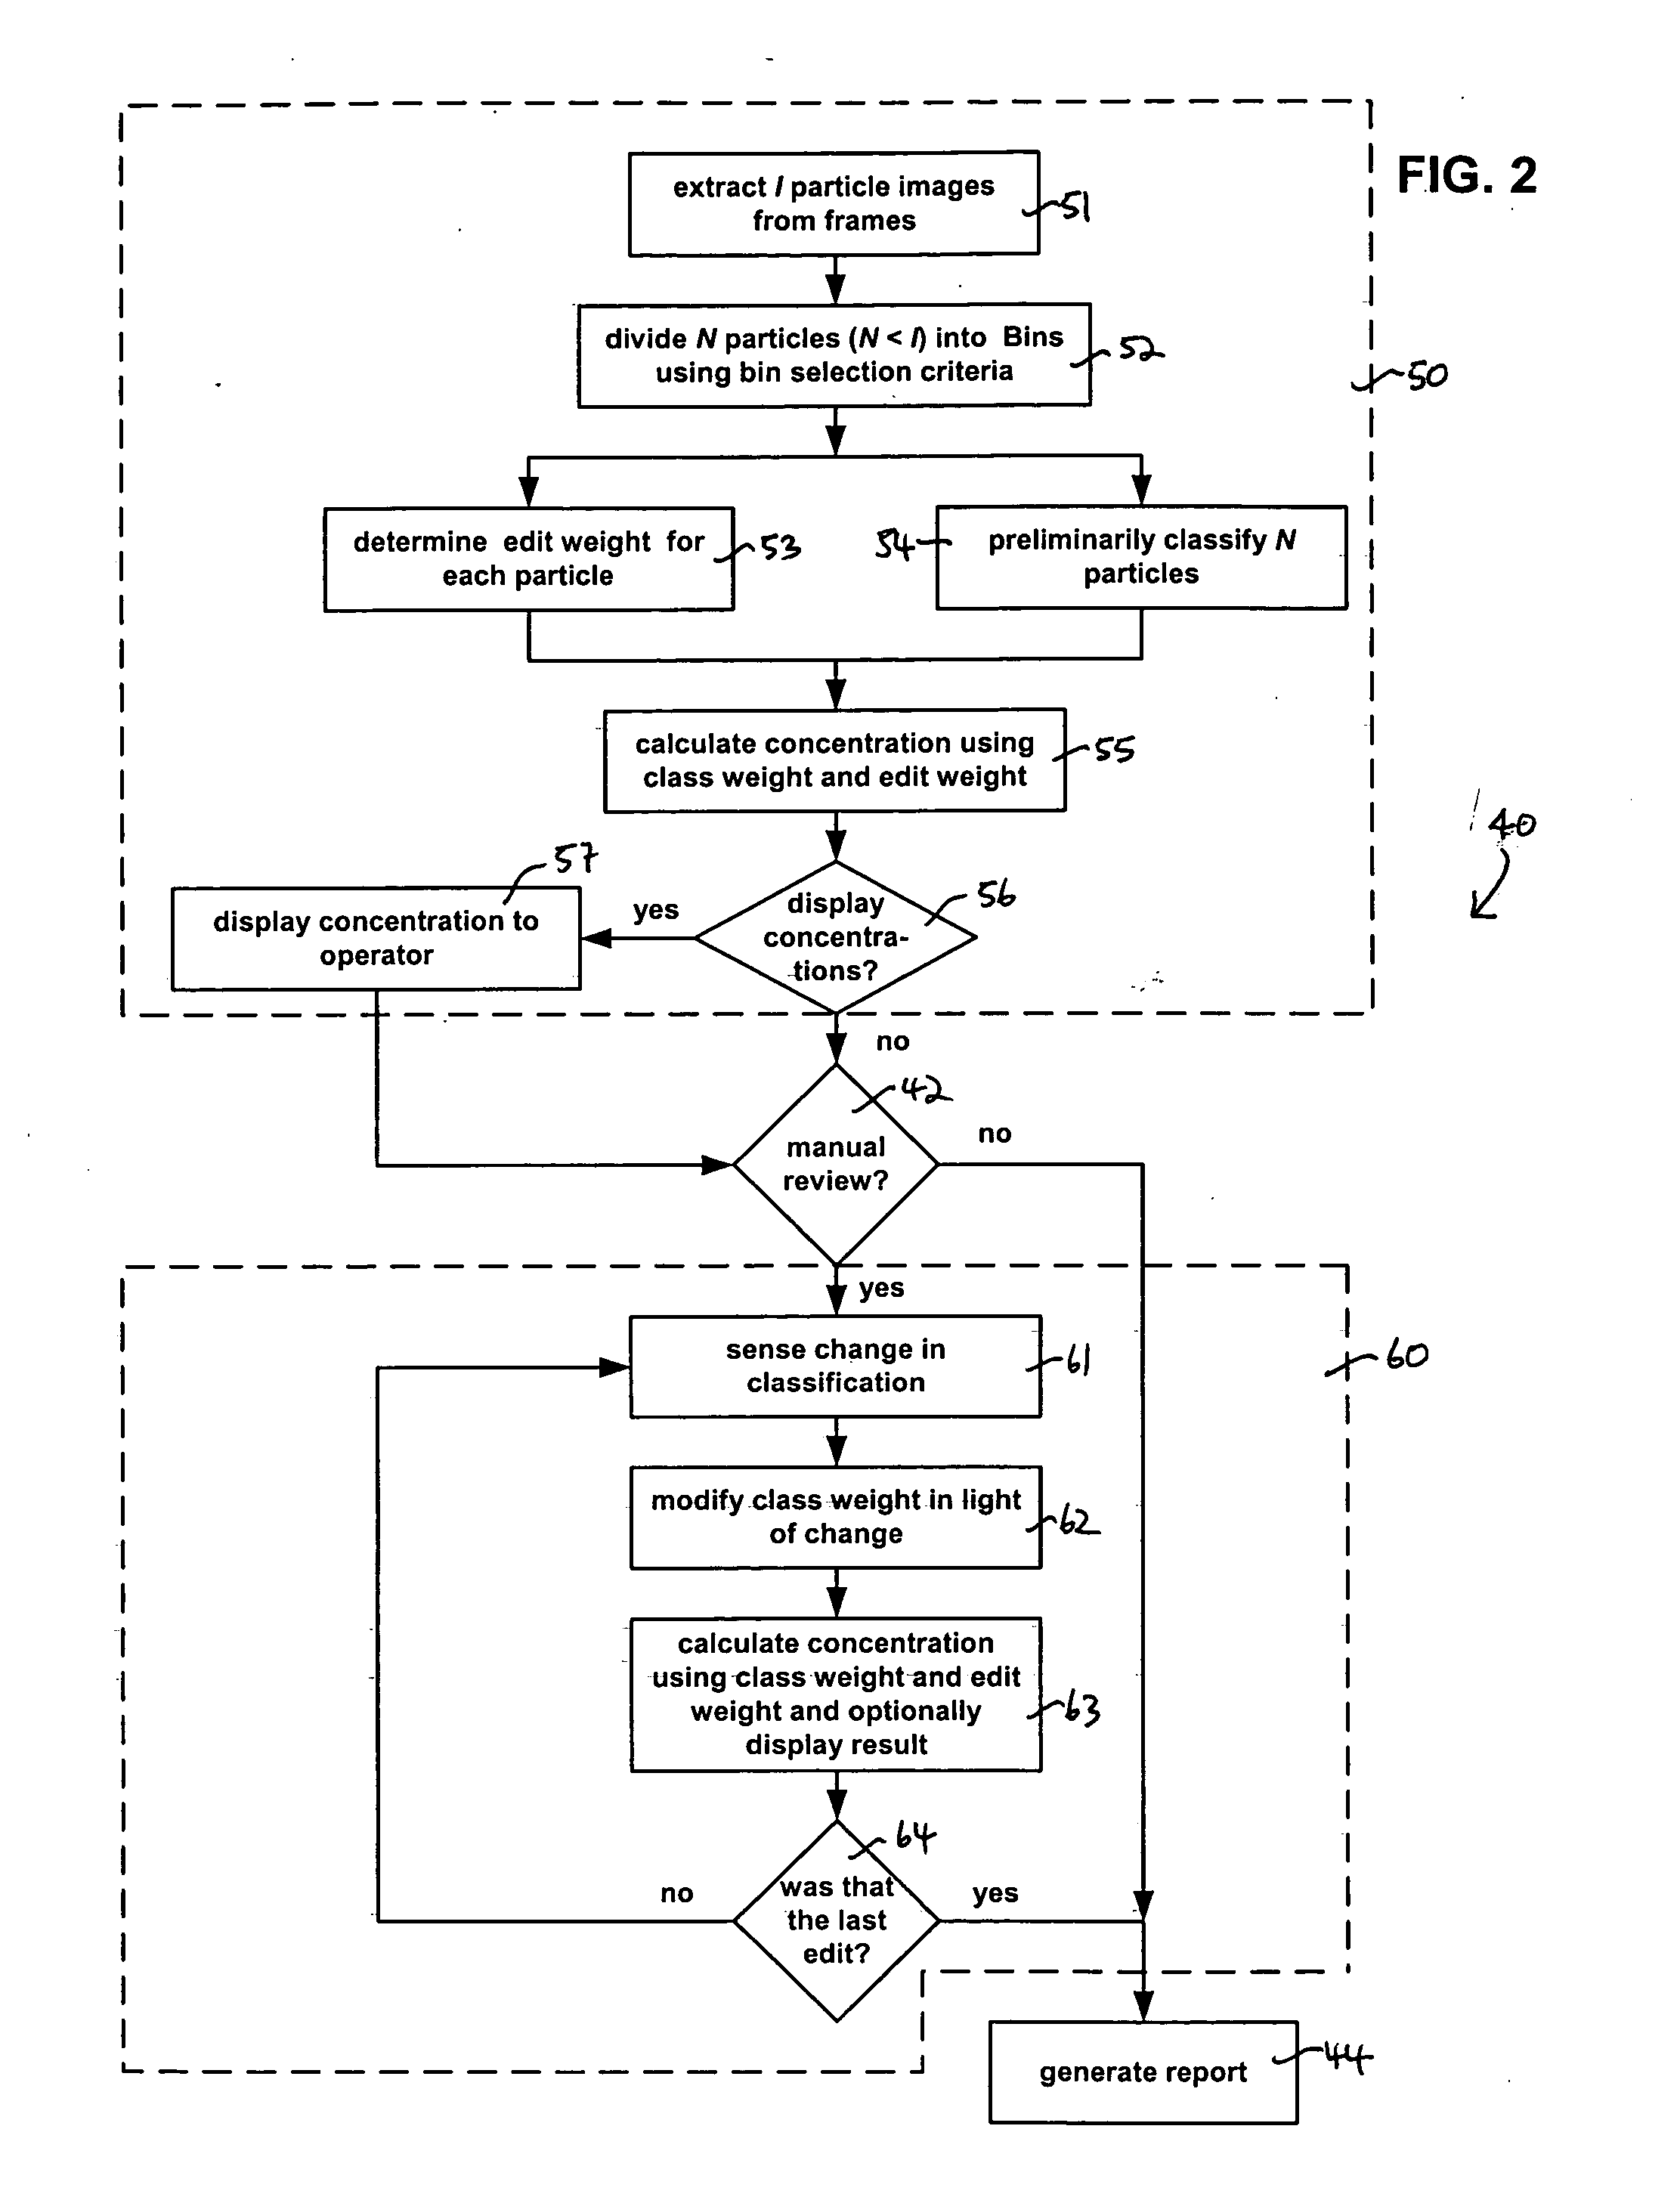
The invention provides a method and system for improving the accuracy of particle concentrations determined by a fluid sample analyzer while shortening the amount of review time required of the operator.
Problems solved by technology
The complete classification yields an accurate result but demands a lot of time from the operator.
The partial classification demands less time from the operator but the accuracy may be compromised.
Method used
Image
Click on the blue label to locate the original text in one second.
Reading with bidirectional positioning of images and text.
Examples
example 1
This example illustrates the effect of reclassification on class weight and concentration. Suppose there is a three-class system having class R, class W, class C, and an artifact class. Suppose also that CWR=2, CWW=1.5, and CWC=4. After the APR process, there are 40 particles in class R, 20 particles in class W, 5 particles in class C, and 50 particles in the artifact class per unit volume. The total number of particles (N) is 115. The initial concentrations should be as follows:
CR=2×40=80 particles / volume
CW=1.5×20=30 particles / volume
CC=4×5=20 particles / volume.
Assuming REF=1 and using Equation (1) and Equation (2) provided above:
The reclassification results show that there is no dramatic change in concentration by moving one particle (overall result of the three moves being reclassi...
example 2
This example illustrates the effect of classifying particles that were originally classified in the artifact class. The same initial conditions are assumed as in Example 1. During reclassification, five artifacts are moved to class C. Again assuming REF=1 and using Equations (1) and (2), the new concentrations are as follows:
Moving five artifacts into class C almost doubled the concentration of class C.
An Alternative Method
Now, an alternative method for recalculating the class weight and concentration will be presented. The preliminary classification steps are the same for this alternative method as for the method descried above.
In this alternative method, decreasing of the class weight is preferably performed using the following equation: {CWn=1|CW=1CWn=Maximum (1,[∑{Class...
example3
This example illustrates the effect of reclassification on class weight and concentration using Equations (3), (4), and (5). Suppose the same initial conditions as that provided above in Example 1. If the operator reclassification moves two of the particles that were originally in class W to class R and one of the particles in class R to class W (total number of reclassified particles=3), the class weights do not change, per situation iii) described above. Using the same class weights and REF=1, the concentrations calculated with Equation (5) are as follows:
CR=2×41 =82 particles / volume
CW=1.5×19=28.5 particles / volume
CC=4×5=20 particles / volume
PUM
Abstract
Most automatic particle classification methods produce errors. The invention provides a method for improving the accuracy of particle classification while shortening the amount of manual review time required from the operator. The method uses class weights, which are statistically-derived correction factors that accounts for frequency of classification errors. A first class weight and a second class weight are assigned to the first class and the second class, respectively. The number of particles in each of the first and the second classes is multiplied by the first class weight and the second class weight, respectively, to generate a corrected number of particles in each of the classes. If particles are reclassified, the class weights are recalculated in response to the reclassification. The method is usable with a complete classification where all the particles in a sample are classified, or a selective classification of a subset of the particles in the sample.
Description
FIELD OF THE INVENTION The present invention relates generally to methods and systems for analyzing particles in a sample and more particularly for determining the concentration of particles in the sample. BACKGROUND OF THE INVENTION Methods and apparatuses for processing images of particles in a fluid sample are well known. For example, U.S. Pat. Nos. 4,667,335 and 4,612,614 describe apparatuses having a software program that determines various characteristics of particles (e.g., biological particles) by using an imaging signal. The apparatuses disclosed in these references can automatically—i.e., without human intervention—determine characteristics such as color, size, and brightness of particles in a fluid sample. Moreover, based on the determined characteristics, these apparatuses can categorize each particle into one of many classes and calculate the concentration of each particle type (i.e., particle class). This automatic sample analysis and concentration determination proc...
Claims
Application Information
Patent Timeline
Application Date:The date an application was filed.
Publication Date:The date a patent or application was officially published.
First Publication Date:The earliest publication date of a patent with the same application number.
Issue Date:Publication date of the patent grant document.
PCT Entry Date:The Entry date of PCT National Phase.
Estimated Expiry Date:The statutory expiry date of a patent right according to the Patent Law, and it is the longest term of protection that the patent right can achieve without the termination of the patent right due to other reasons(Term extension factor has been taken into account ).
Invalid Date:Actual expiry date is based on effective date or publication date of legal transaction data of invalid patent.

