Computer systems and methods for visualizing data

a computer system and data technology, applied in the field of computer systems and methods for visualizing data, can solve the problems of limiting the types of analysis that can be performed on data using such graphical interfaces, complex dimension hierarchies, and inability to skip levels in defined hierarchies

Active Publication Date: 2005-03-17
THE BOARD OF TRUSTEES OF THE LELAND STANFORD JUNIOR UNIV
View PDF33 Cites 213 Cited by
  • Summary
  • Abstract
  • Description
  • Claims
  • Application Information

AI Technical Summary

Benefits of technology

The present invention provides improved methods for visualizing data. In the present invention, dimensions are not constrained to lie on a single axis of a graphical interface. Further, dimens...

Problems solved by technology

However, there are more complex dimension hierarchies where the aggregation path can branch.
Although the software programs illustrated in FIGS. 17 and 18 are useful, they are often...

Method used


Image

  • Computer systems and methods for visualizing data
  • Computer systems and methods for visualizing data
  • Computer systems and methods for visualizing data

Examples


Embodiment Construction

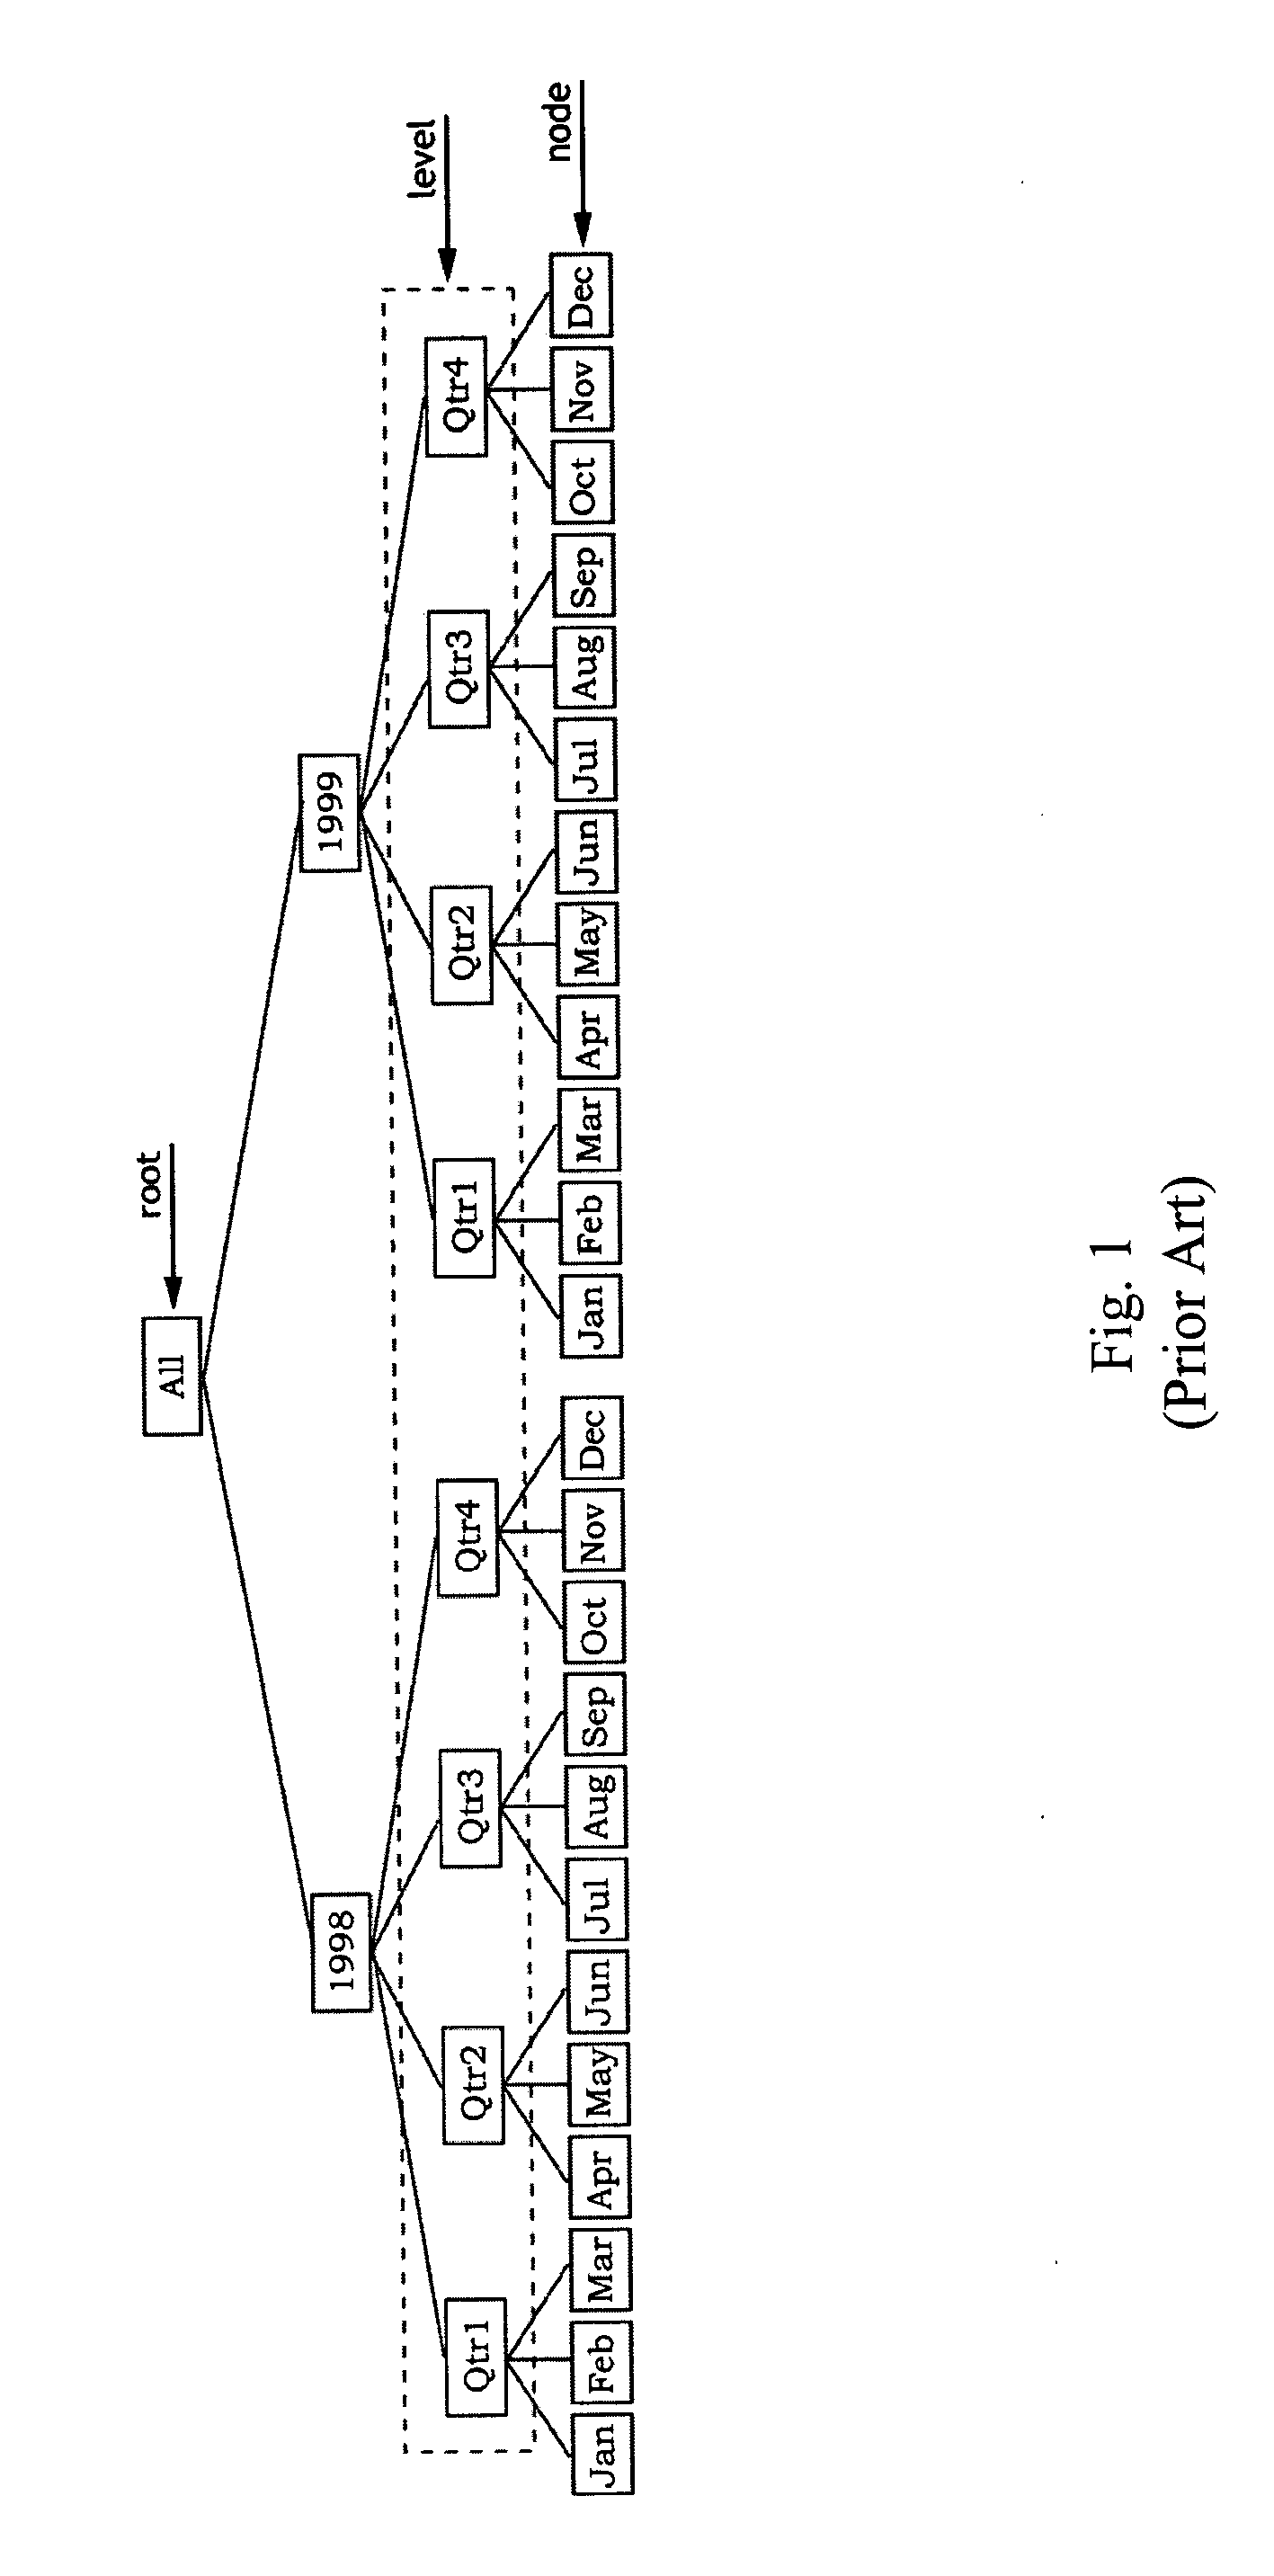
The present invention provides computer systems and methods for visualizing data such as database information. In a typical embodiment of the present invention, a user specifies a search query and data is displayed in a graphic. Advantageously, in the computer systems and methods of the present invention, a dimension can be displayed on more than one axis of the graphic. More specifically, levels in a dimension can span multiple axes, group bys, and visual encodings. Furthermore, levels (e.g., quarter, month) within dimensions are not constrained to their natural hierarchical order. In fact, levels defined in a hierarchy can be skipped. Another advantage of the present invention is that measures are not constrained to text table format; they can be illustrated in any of a number of graphical manifestations.

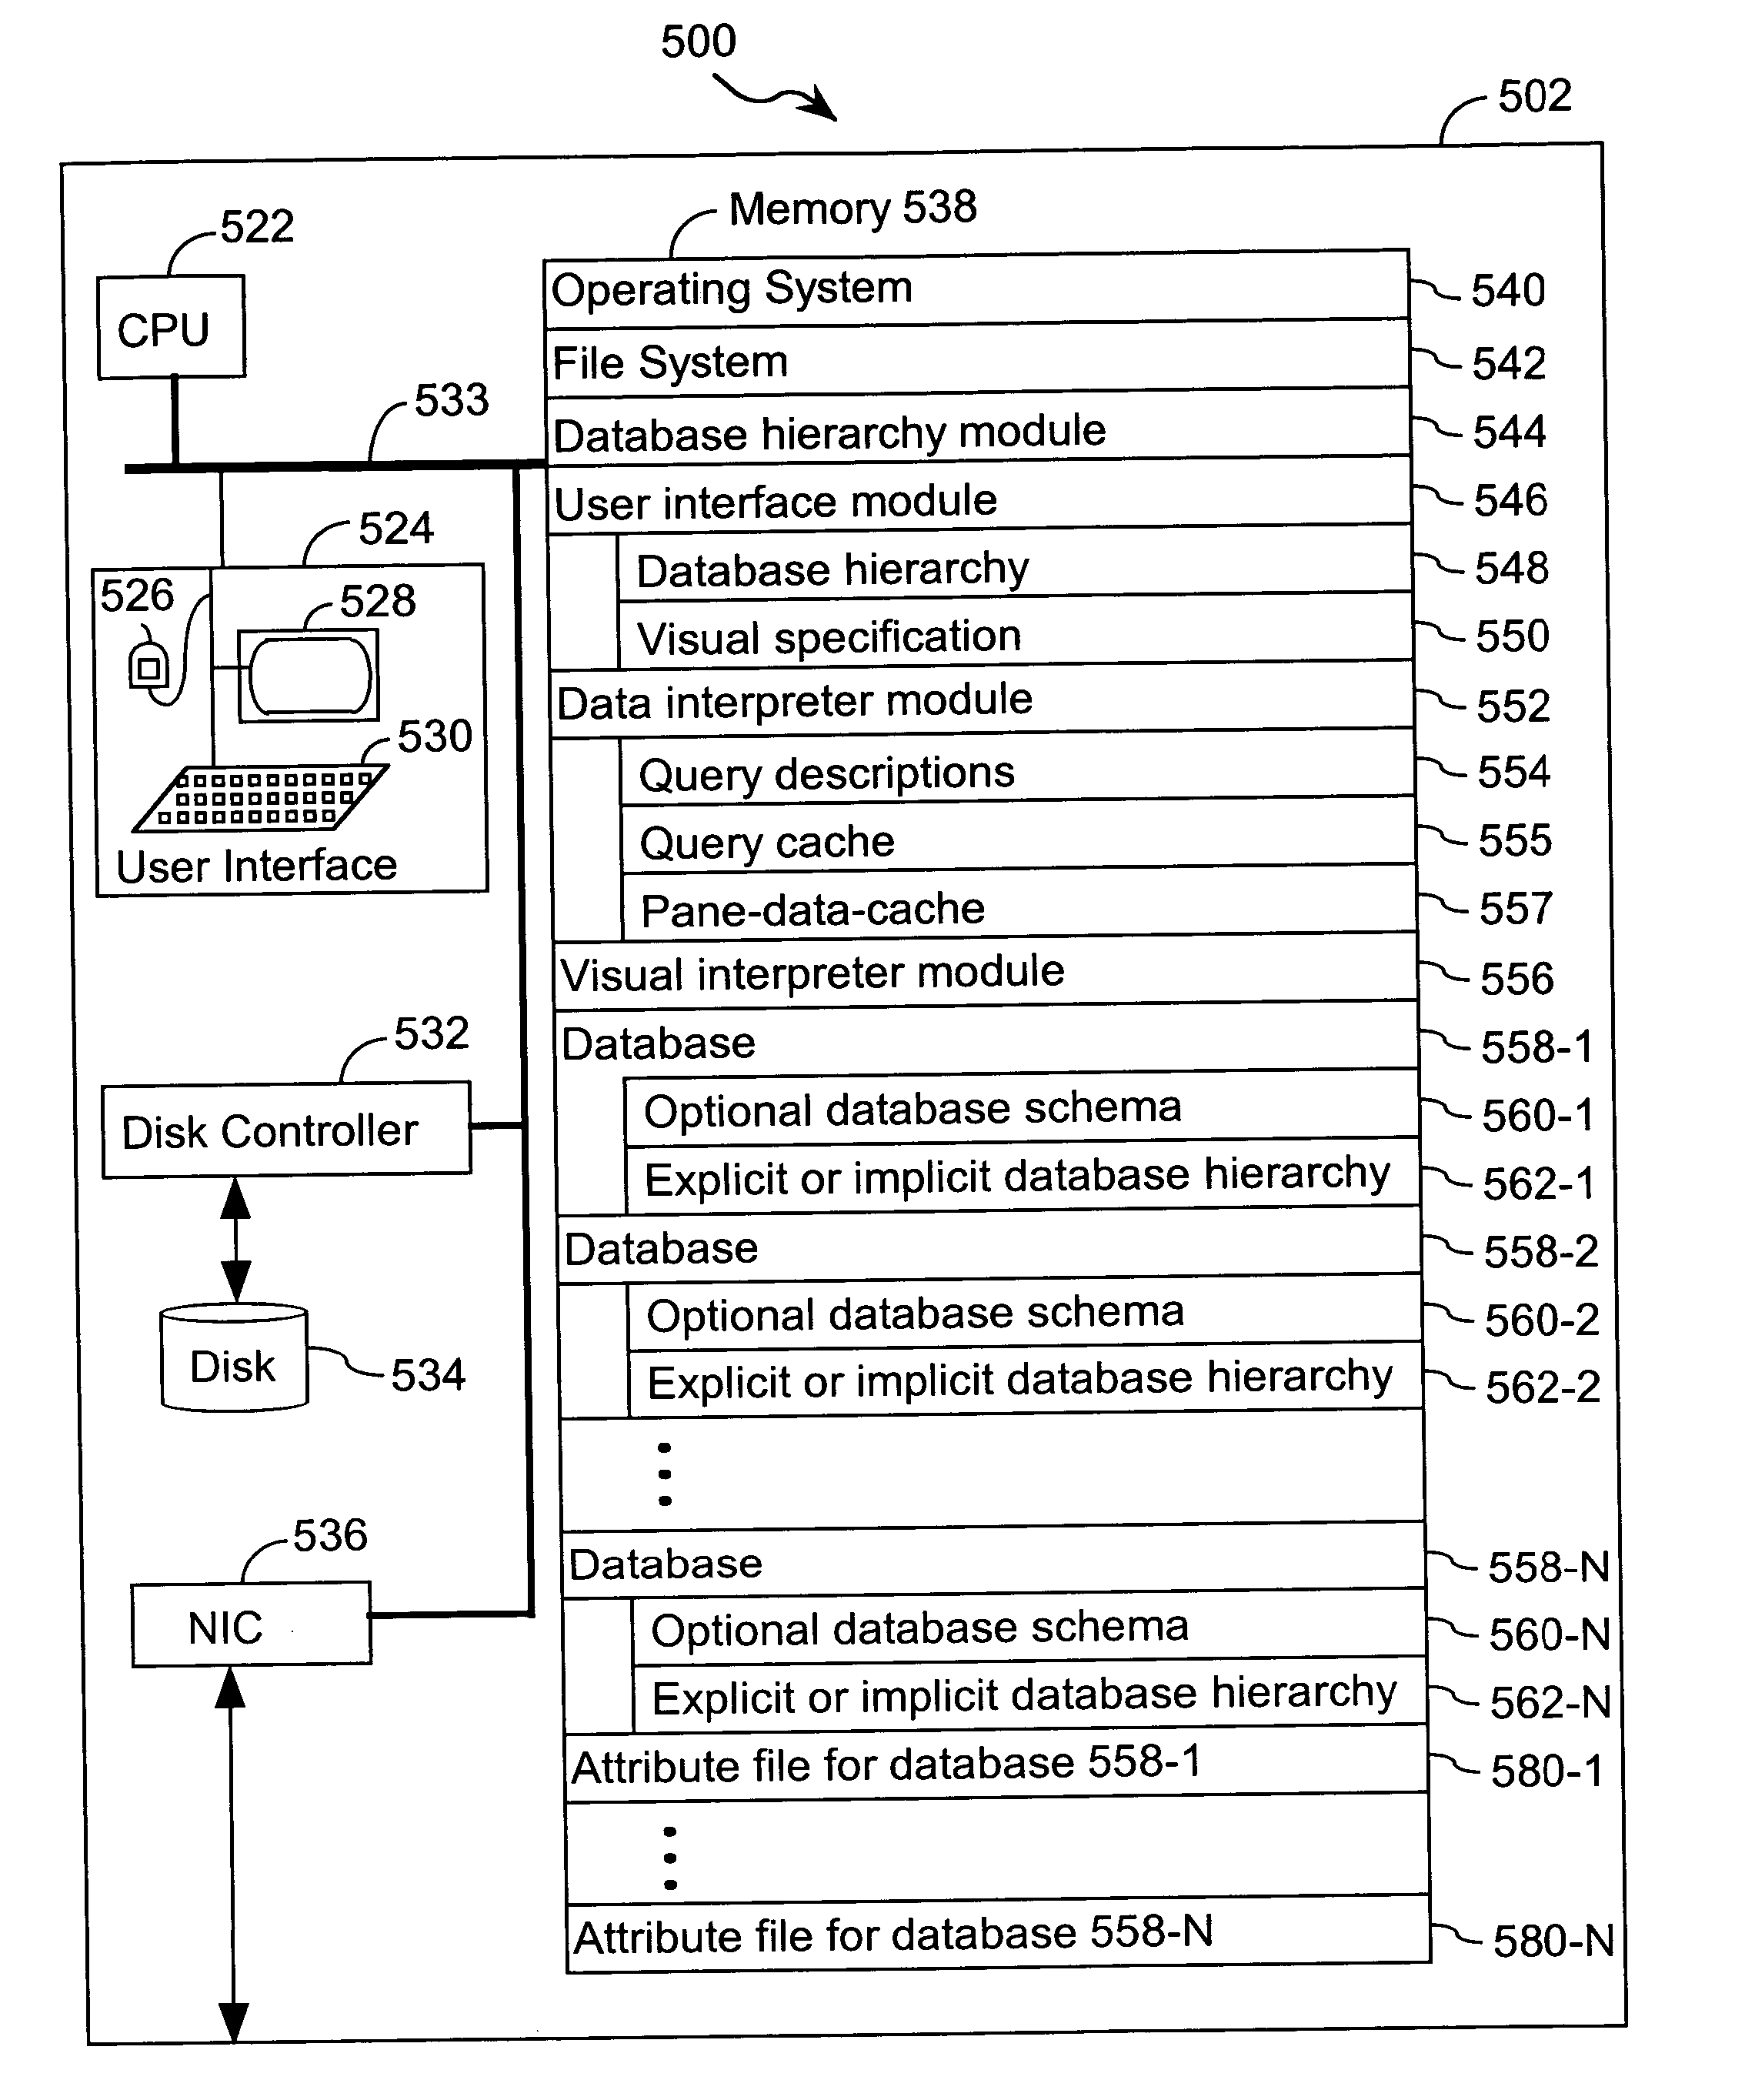
Presented in Section 5.1 below is an overview of an exemplary system for visualizing database queries. The system can be used to visualize database queries using the methods of...


PUM


Abstract

A method for forming a visual plot using a hierarchical structure of a dataset. The dataset comprises a measure and a dimension. The dimension consists of a plurality of levels. The plurality of levels form a dimension hierarchy. The visual plot is constructed based on a specification. A first level from the plurality of levels is represented by a first component of the visual plot. A second level from the plurality of levels is represented by a second component of the visual plot. The dataset is queried to retrieve data in accordance with the specification. The data includes all or a portion of the dimension and all or a portion of the measure. The visual plot is populated with the retrieved data in accordance with the specification.

Description

1. FIELD OF THE INVENTION This invention relates generally to computer systems and methods for visualizing data such as database information. 2. BACKGROUND OF THE INVENTION Imposing meaningful hierarchical structure on large databases provides levels of abstraction that can be leveraged by both the computer and the analyst. These hierarchies can come from several different sources. Some hierarchies are provided by the inherent nature of the database. Data mining algorithms, such as decision trees and clustering techniques that classify the data and thereby automatically derive hierarchies can be used to determine database hierarchy. Part of the analysis task when dealing with automatically generated hierarchies is an understanding and trusting the results. See, for example, 2001, Thearling et al., “Visualizing Data Mining Models” in Information Visualization in Data Mining and Knowledge Discovery, Fayyad, Grinstein and Wierse eds., Morgan Kaufinan, which is hereby incorporated by ...

Claims


Application Information

Patent Timeline
IPC IPC(8): G06FG06F7/00G06F17/30
CPCG06F17/30554G06F17/30292G06F17/30592G06F17/30572G06F16/211G06F16/26G06F16/248G06F16/283
Inventor STOLTE, CHRISHANRAHAN, PATRICK
Owner THE BOARD OF TRUSTEES OF THE LELAND STANFORD JUNIOR UNIV
Why Eureka
Try Eureka