

Matrix methods for quantitatively analyzing and assessing the properties of botanical samples
a botanical sample and matrix method technology, applied in the field of computation methods, can solve the problems of unique challenges, differences in manufacturing protocols, aging and shelf life of botanical drugs, etc., and achieve the effect of maintaining or improving the desired biological activity
- Summary
- Abstract
- Description
- Claims
- Application Information
AI Technical Summary
Benefits of technology
Problems solved by technology
Method used
Image

Examples
example 1
Generating a Matrix Fingerprint Using Chemical Data
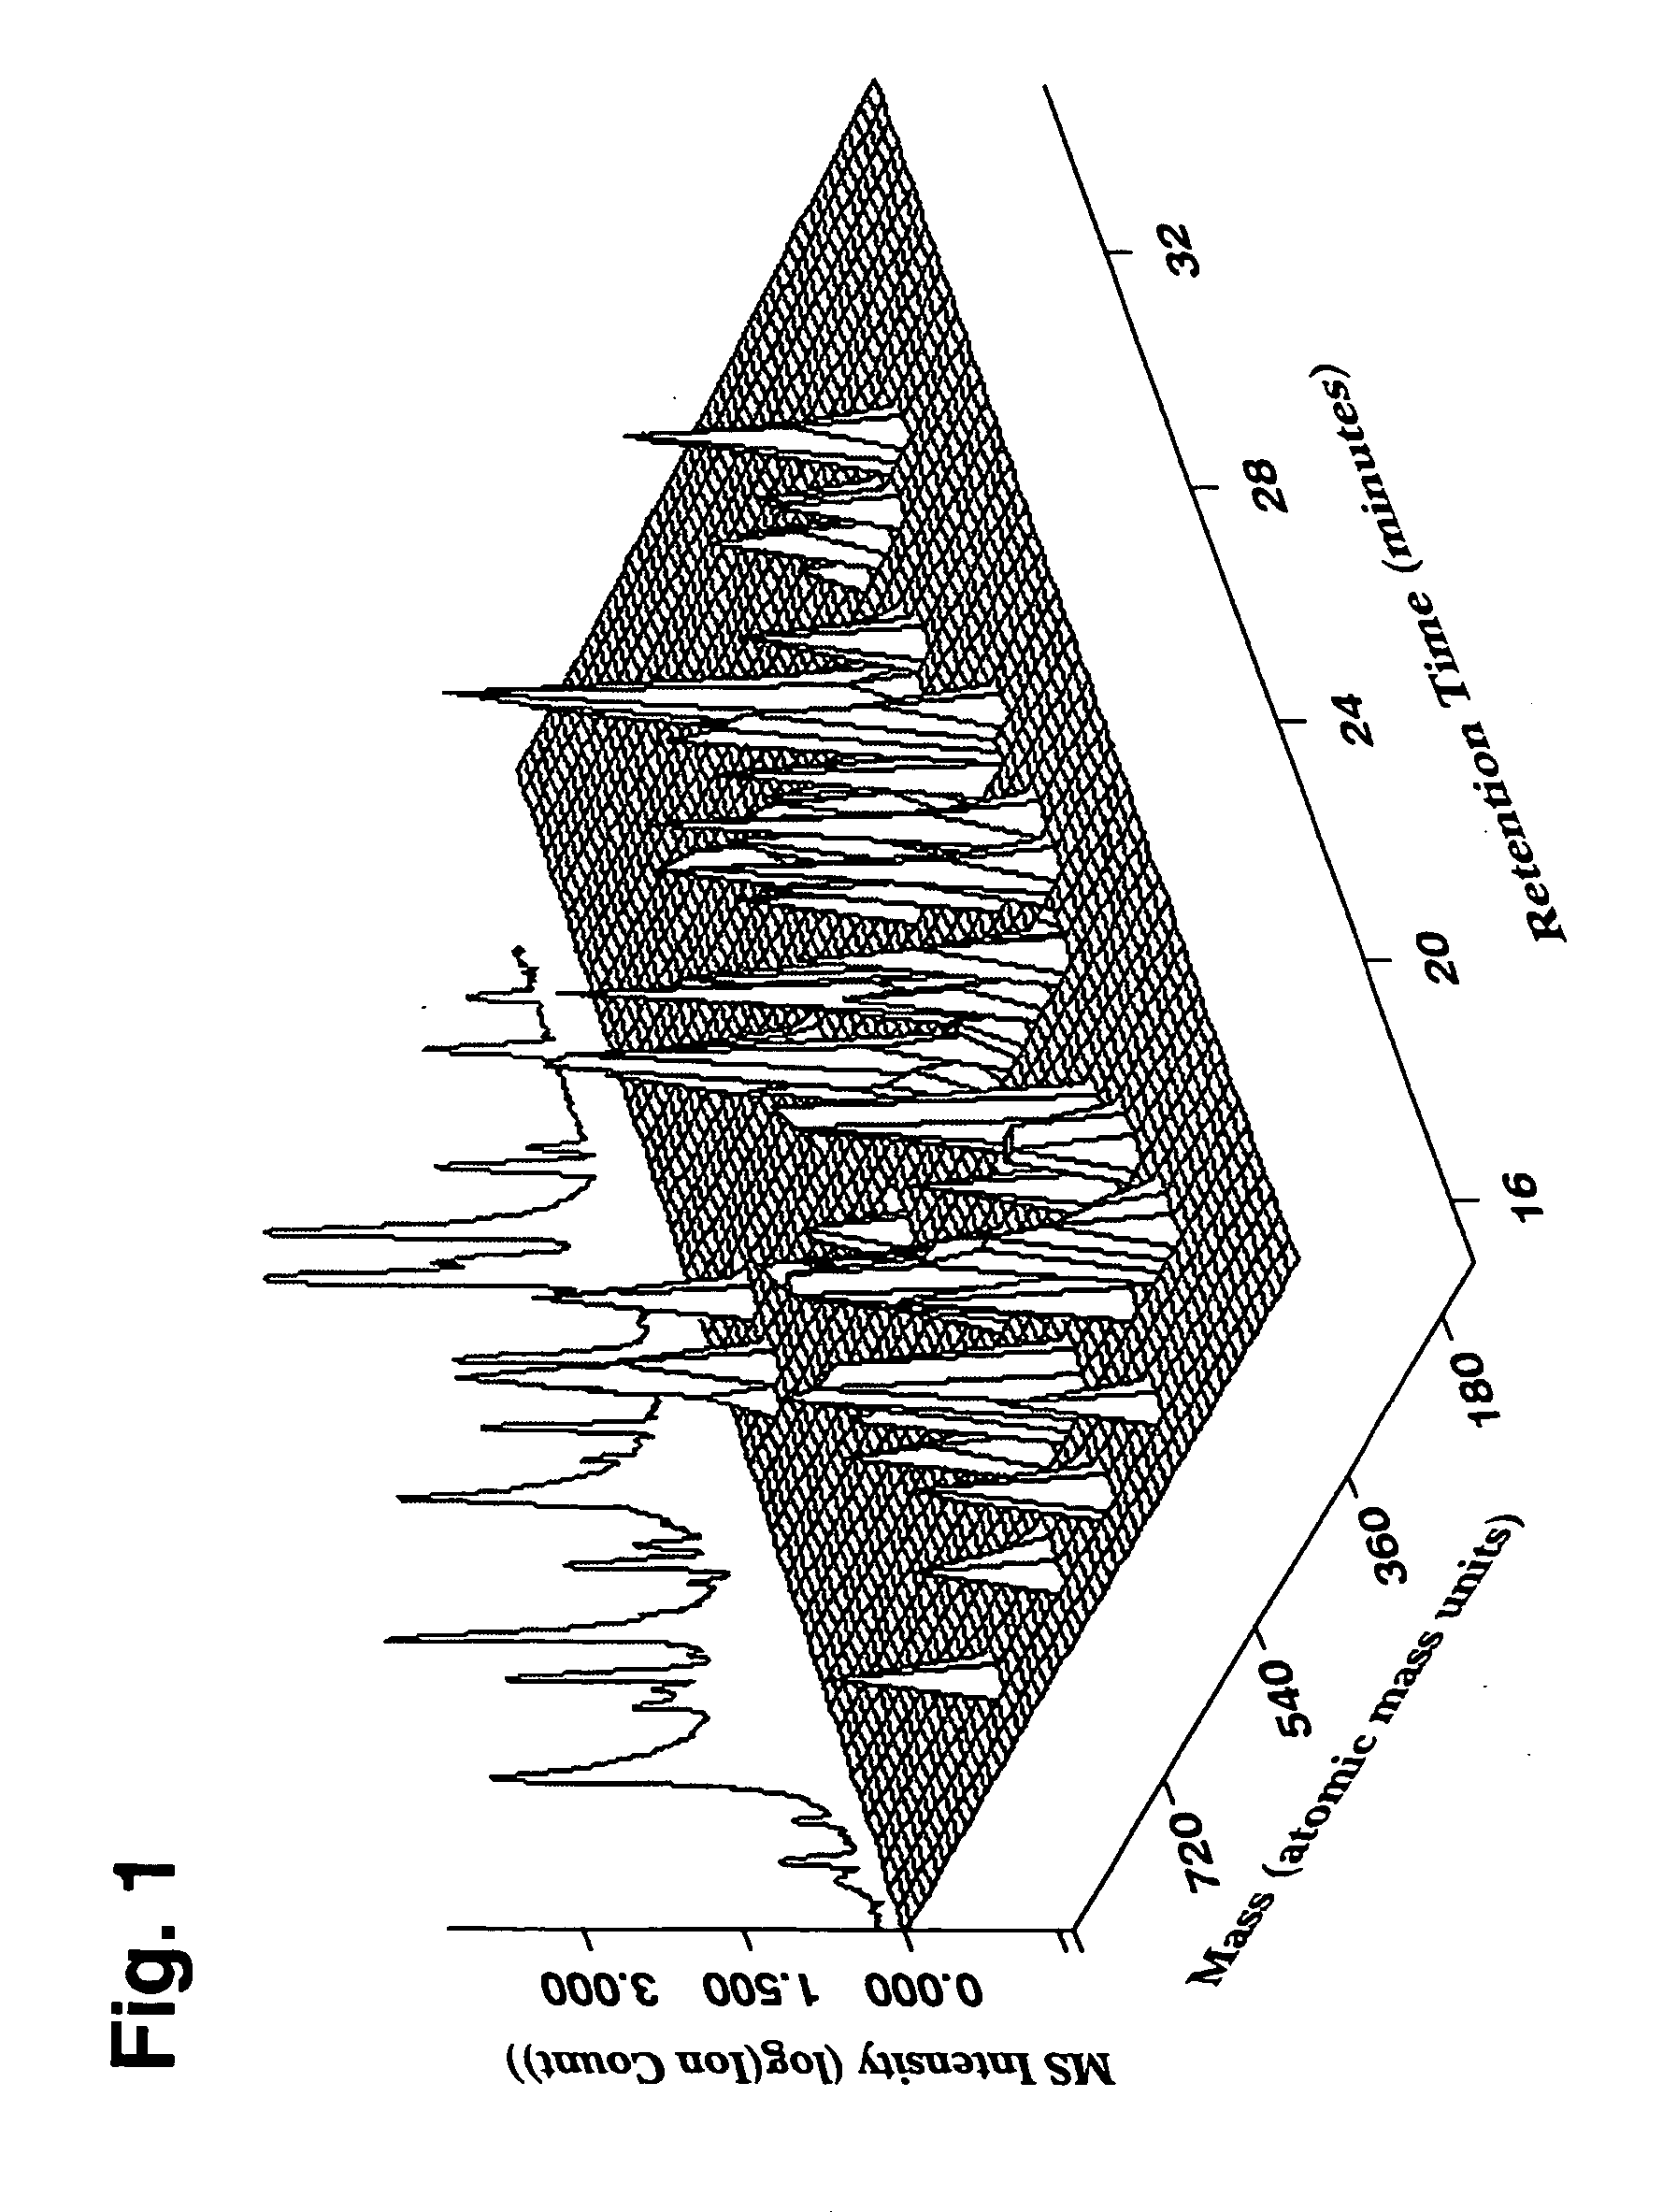
A unique one dimensional, two dimensional, or higher dimensional chemical fingerprint of a multi-component botanical drug can be collected via a number of experimental analytical assays. Detection methods may include UV / VIS, ELSD, infrared, NMR, refractive index, mass spectrometry etc. Any detection method can be used as long as the data generated can be indexed and digitized. We illustrate the generation of a matrix fingerprint with high resolution data from LC-MS of a complex botanical formulation consisting of four botanicals. FIG. 1 shows a small region of a three-dimensional plot of the Liquid Chromatography-Mass Spectrometry (LC-MS) chemical fingerprint for a botanical formulation. Along one dimension of the plot is the separation of individual components along a chromatography separation axis with a noted retention time that can be correlated with a water / octonol partition coefficient (logP) or a computed logP from a unique...
example 2
Generating a Matrix Fingerprint Using Biological Data
Both single molecules and multicomponent mixtures of molecules can elicit a multitude of biological responses either in vivo, cell culture or in vitro across a panel of individual biomolecular assays. Very often there are linkages or pattern relationships between individual components of the overall biological response, e.g. one protein level may go up and is counterbalanced by two other protein levels that go down. Other examples would include correlated changes in individual message RNA levels, individual protein expression levels, bioresponse levels of endogenous metabolites, cytokine responses, enzyme activities, cellular pathways etc. We illustrate the construction of a bioresponse matrix from a multicomponent mixture using both genomic and proteomic data as examples.
Genomic Response Fingerprint:
Genomic bioresponse data can be collected by a variety of methods. The most holistic method would include utilizing a microarr...
example 3
Using Matrix Fingerprints to Compute a Similarity Index Between Samples
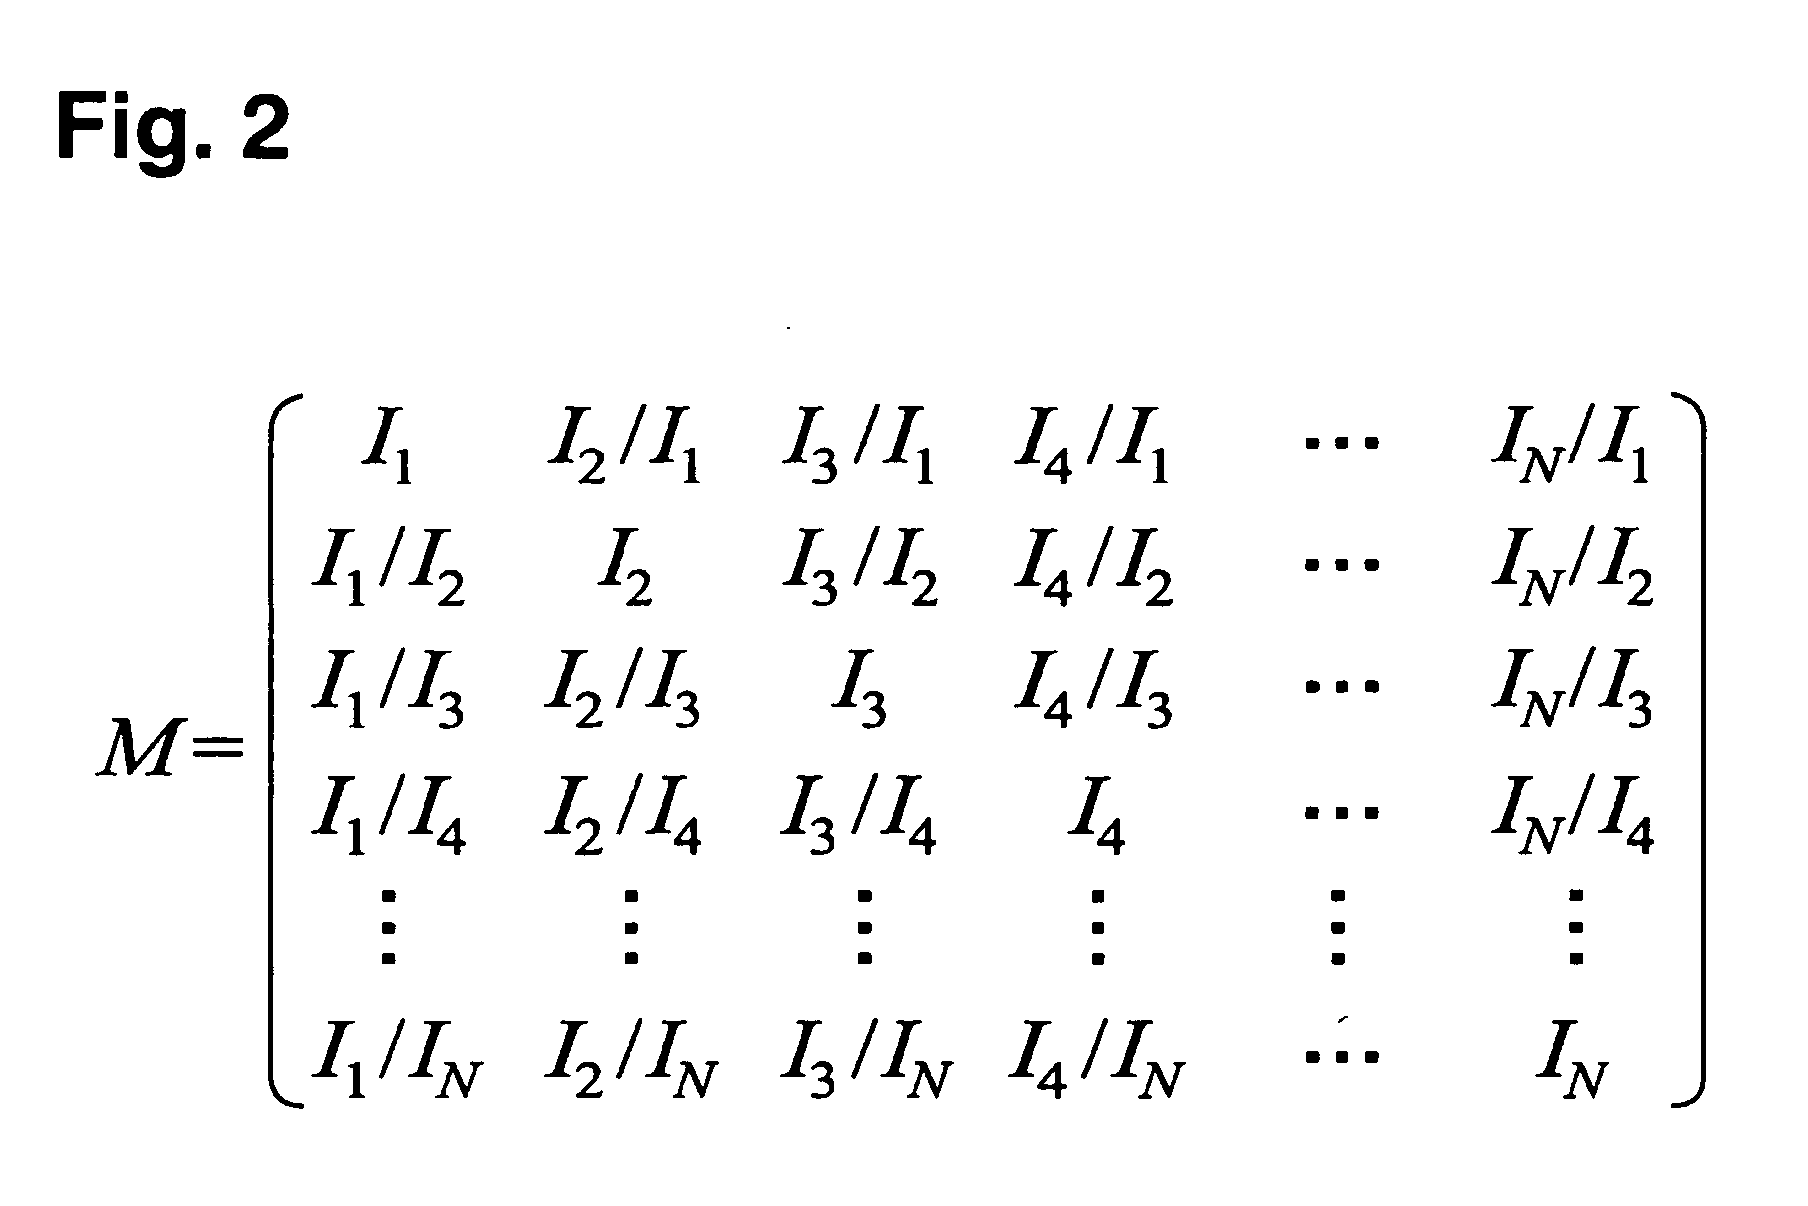
When checking for similarity among different botanical samples, one may compare the intensity matrices for each sample instead of matching only the intensities of individual peaks. Since the intensity matrices generated in this way represent all inter-spectrum ratios, the problem at hand is comparing patterns of ratios between two matrices. The statistical correlation of these patterns is a key component embodied in the Phytomics Similarity Index (PSI). We illustrate two examples of the PSI; unweighted and weighted.
The example procedure is as follows: given two samples, first find all the datapoints common in both samples (intersection) and calculate the intensity matrix for each sample using these common datapoints (datapoint for example may represent an LC / MS peak, UV / VIS peak, gene intensity, protein level, cytokine level etc. that has been incorporated into the matrix). Once the matrices are formulated, t...
PUM
 Abstract
Description
Claims
Application Information