
Methods and systems for cryogenic cooling
a technology of cryogenic cooling and systems, applied in lighting and heating apparatus, contraceptives, therapy, etc., can solve the problems of limiting the cost efficacy and probe diameter, impede the flow of liquid cryogen, etc., to prevent vapor lock, reduce molar volume, and increase the pressure of cryogen
- Summary
- Abstract
- Description
- Claims
- Application Information
AI Technical Summary
Benefits of technology
Problems solved by technology
Method used
Image

Examples
Embodiment Construction
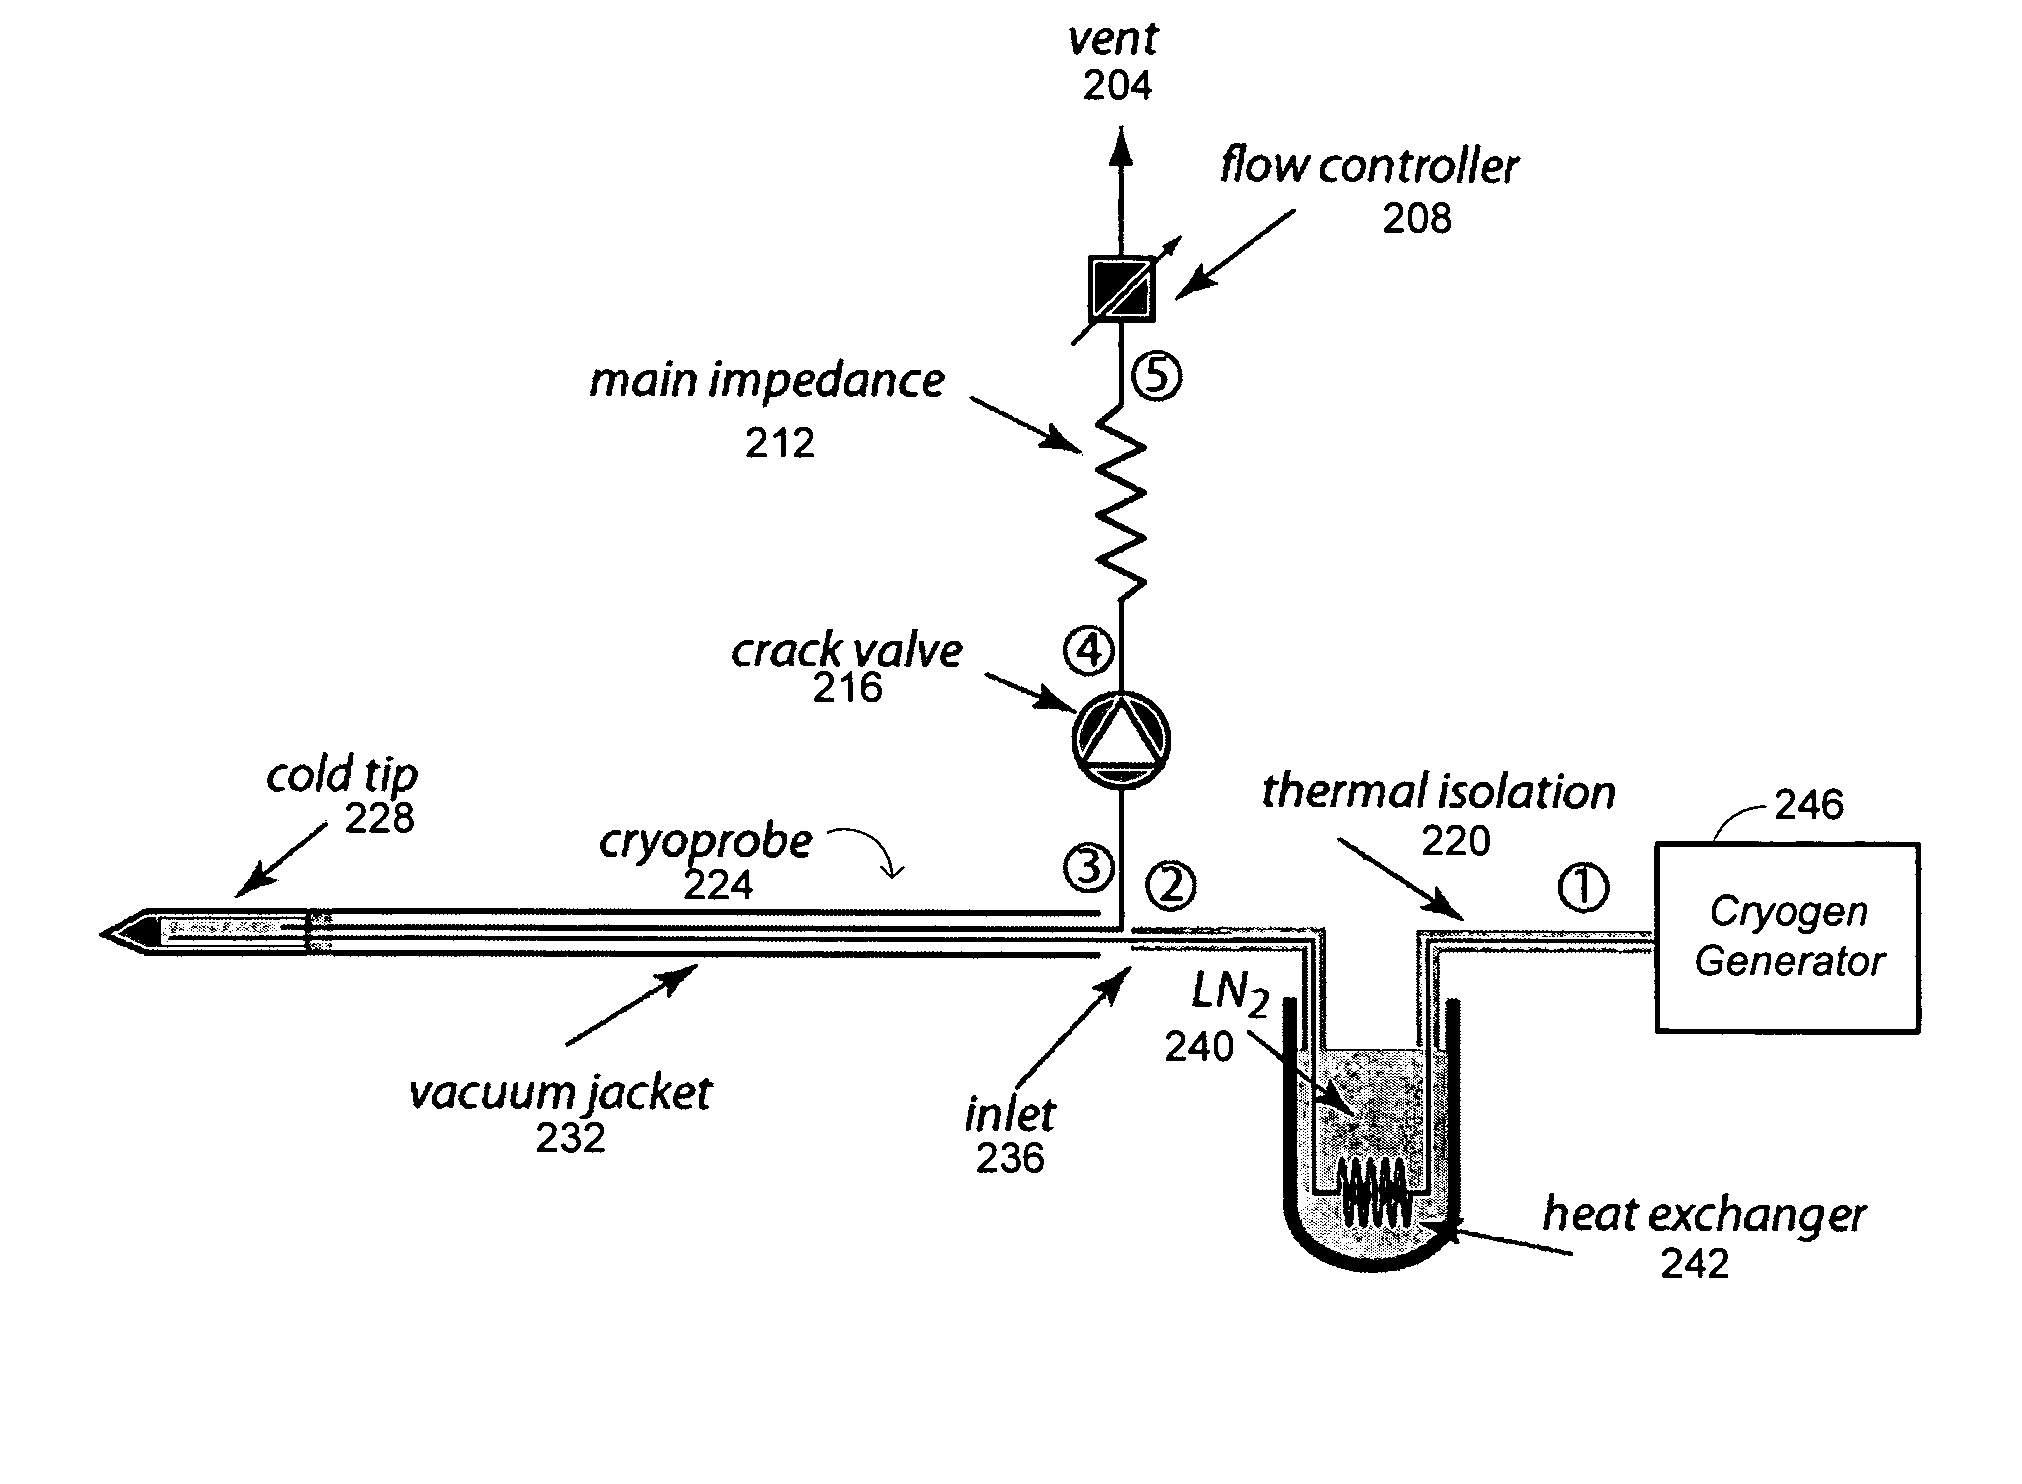
[0030] Embodiments of the invention make use of thermodynamic processes using cryogens that provide cooling without encountering the phenomenon of vapor lock. Various other benefits and advantages provided in different embodiments of the invention are apparent from the following description.
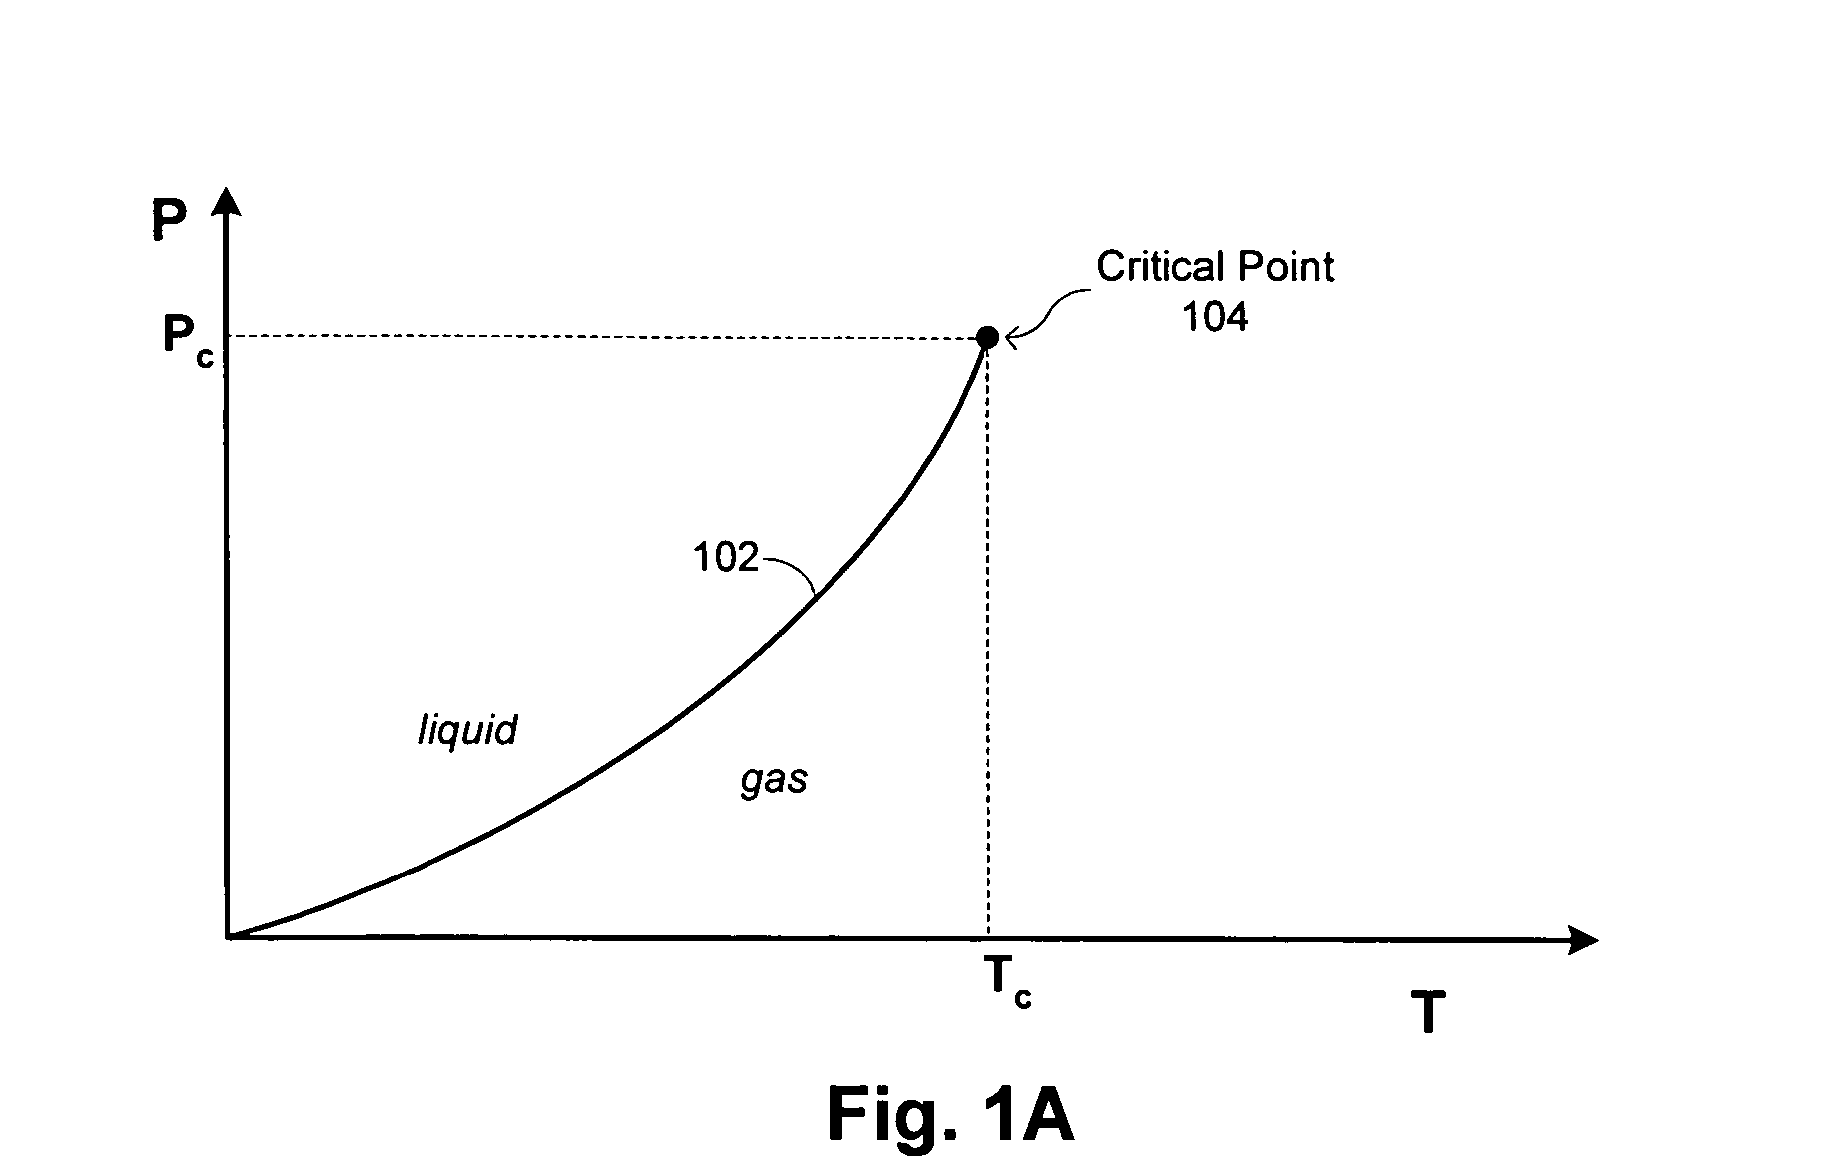
[0031] This application uses phase diagrams to illustrate and compare various thermodynamic processes. Such phase diagrams are well known in the art and an example typical for a cryogen is provided in FIG. 1A. The axes of the diagram correspond to pressure P and temperature T, and includes a phase line 102 that delineates the locus of all (P,T ) points where liquid and gas coexist. For (P, T ) values to the left of the phase line 102, the cryogen is in a liquid state, generally achieved with higher pressures and lower temperatures, while (P, T) values to the right of the phase line 102 define regions where the cryogen is in a gaseous state, generally achieved with lower pressures and higher temp...
PUM
 Abstract
Description
Claims
Application Information