
User control for dynamically adjusting the scope of a data set

a user control and data technology, applied in computing, metadata audio data retrieval, instruments, etc., can solve the problems of difficult to provide the user with easy-to-understand views and organizational tools for filtering and displaying large sets of data, the amount of information, data and content that is returned based on such searches is often times still voluminous enough to be overwhelming

Inactive Publication Date: 2005-12-15
MICROSOFT TECH LICENSING LLC
View PDF16 Cites 170 Cited by
  • Summary
  • Abstract
  • Description
  • Claims
  • Application Information

AI Technical Summary

Benefits of technology

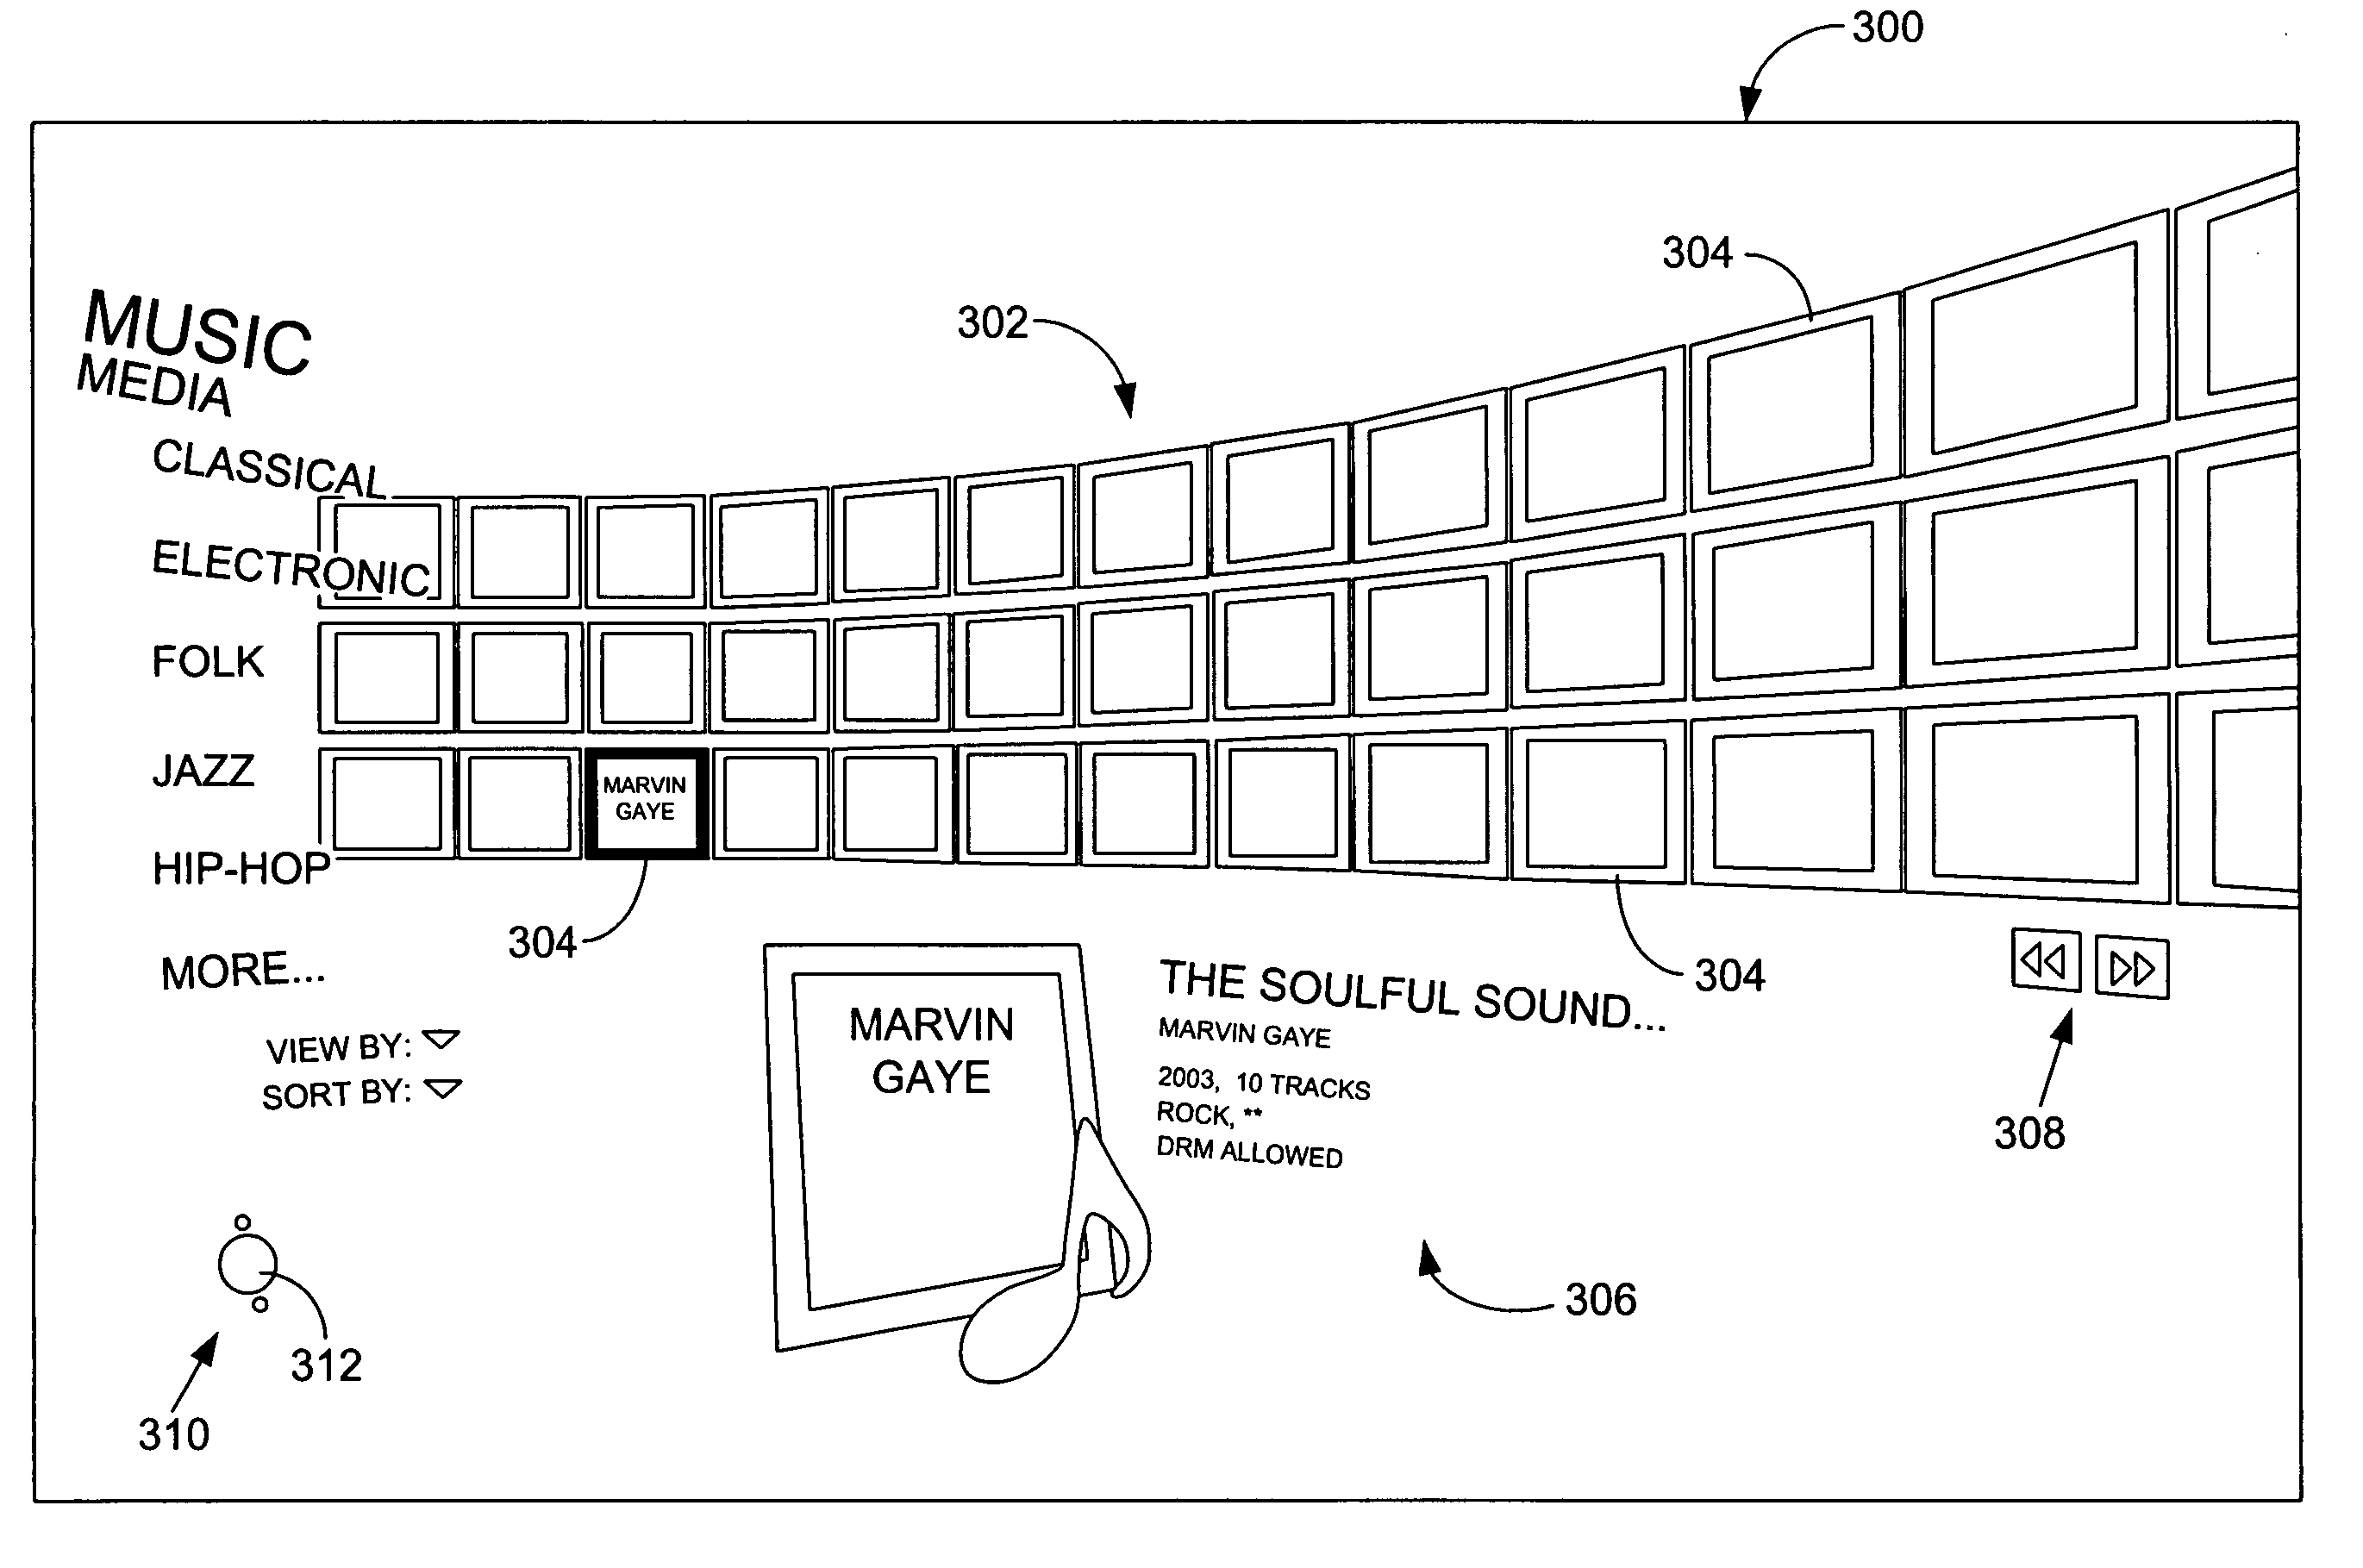
[0012] By combining scope control with the data display options permitted by, for example, a 3-D UI design, access may be provided to a large range of information without overwhelming the user. Scope control manages both the type of content and the amount of content that is displayed in any particular screen or view. The scope control tool may be set to define a relatively narrow setting, e.g., a “Me” view wherein only data that is perceived or defined as “belonging” to the user may be displayed, a relatively broad setting, e.g., a “World” view wherein all data in the world meeting one or more defined topical criteria may be displayed, or any number of settings in between—whether precisely defined or on a sliding scale between extremes. The present invention permits both the view and the number of data elements displayed in the viewable display area to shift as the scope applied to a data set is modified. The present invention further permits the inclusion and delineation of one or more narrow subsets of data within the display encompassed by a relatively broad scope setting, if desired.
[0013] Accordingly, in one aspect, the present invention is directed to a UI for representing content, information and data to a user. The user interface includes a configurable visual image display area configured to display at least one visual image and a scope menu display area configured to display a plurality of selectable scope links, each indicative of a data scope capable of being applied to a data set. Upon selection of a first selectable scope link, e.g., a scope link indicative of the “Me” view, a visual image display is generated which displays visual images indicative of a first quantity of topically-related data elements. Upon selection of a second selectable scope link, e.g., a scope link indicative of the “Family” view, a visual image display is generated which displays visual images indicative of a second quantity of topically-related data elements. In the event that more data elements are present in the data set represented by the “Family” view than are present in the data set represented by the “Me” view (as would typically be the case as the “Family” view generally would be broader than the “Me” view), the visual images indicative of the second quantity of topically-related data elements may appear smaller than the visual images indicative of the first quantity of topically-related data elements. Accordingly, a user would readily be able to visually determine, based upon the size of the visual images alone, that the number of data elements in the data set increased when the scope was changed from the “Me” view to the “Family” view. The degree of change in the size of the images may alert the user to the severity of the change in quantity.

Problems solved by technology

As high speed computer networks extend beyond physical boundaries (e.g., work, home, etc.) to encompass the vast network space that is represented by the Internet, locating and bounding information, content and data becomes increasingly difficult.
), providing the user with easy to understand views and organizational tools for filtering and displaying large sets of data can be challenging.
For instance, with regard to filtering data, while a user is often permitted to conduct content searches based upon key words and the like, the amount of information, data and content that is returned based upon such searches is often times still voluminous enough to be overwhelming as the user has limited filtering options and / or options for setting content parameters.
Additionally, the user often has no means by which to organize and filter the returned data in a manner that would allow presentation of only a manageable amount of information and / or that presents the data in a manner wherein the content most useful to the user is presented in a more prominent fashion (e.g., displayed first in a data listing).
With regard to displaying data, information and content, data sets are often too large for each data element within the set to be represented on the viewable display area.
Thus, when viewing such large data sets, it may be difficult for the user to readily determine how much information, content, or data may be part of the data set but which is not present in the viewable display area.

Method used


Image

  • User control for dynamically adjusting the scope of a data set
  • User control for dynamically adjusting the scope of a data set
  • User control for dynamically adjusting the scope of a data set

Examples


Embodiment Construction

[0033] The present invention provides a user interface (UI) for presenting and displaying data sets to a user that incorporates a filtering device referred to herein as “scope control.” Scope control enables the user to dynamically adjust a current range of view for the information, content and data displayed on the UI. A scope control tool represented, e.g., by a selectable icon, may be accessible from all screens in the UI. The tool may be applied to both traditional list-type views of content or data, as well as to control screens, tools, or application screens. The scope may be set to define a relatively narrow view, e.g., a “Me” view wherein only data that is perceived or defined as “belonging” to a particular individual (such as a user) may be displayed, a relatively broad view, e.g., a “World” view wherein all data in the world meeting one or more defined topical criteria may be displayed, or any number of settings in between—whether precisely defined or on a sliding scale be...


PUM


Abstract

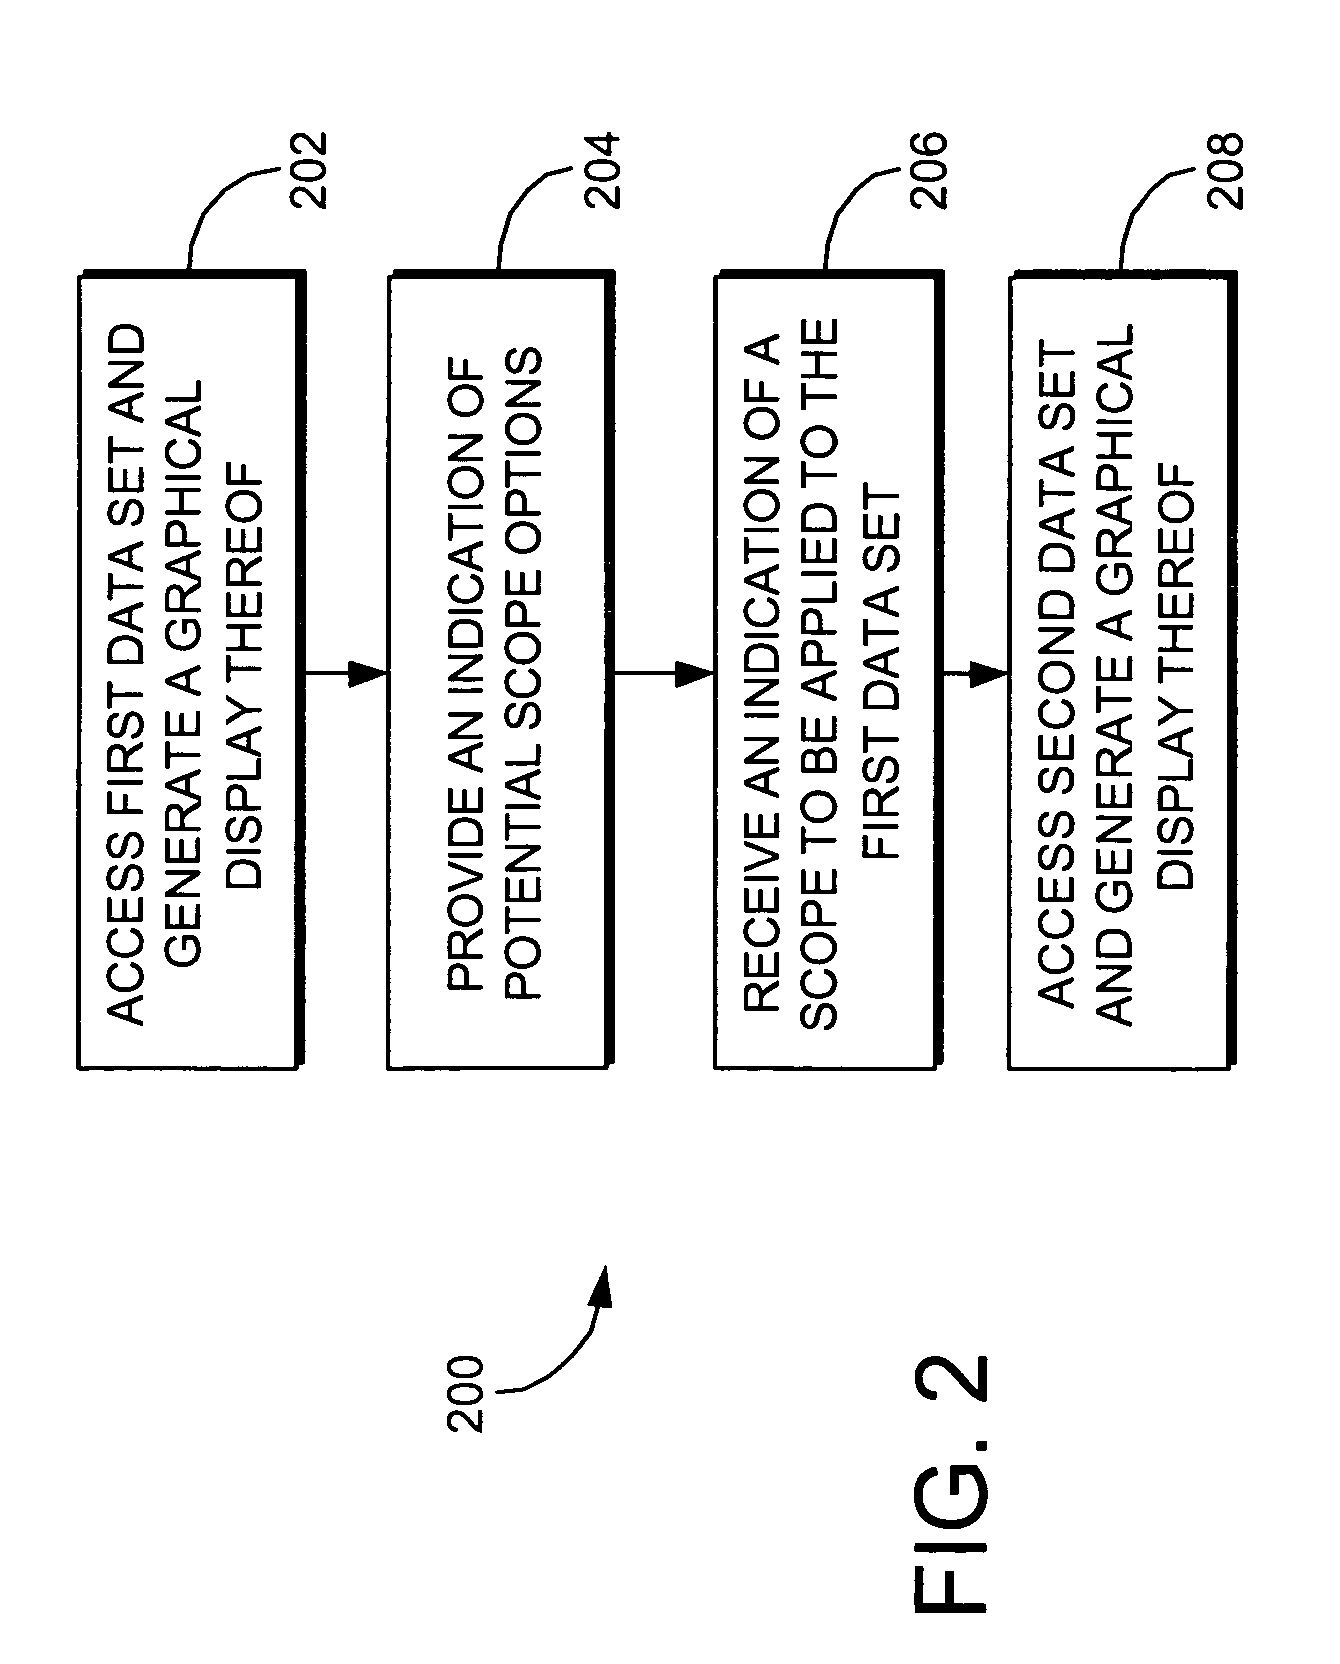
A user control for dynamically adjusting the scope of a set of content, information, and / or data and a user interface (UI) for representing the same are provided. A scope control tool represented, e.g., by a selectable icon, may be accessible from all screens in the UI and may be applied to both traditional list-type views of content or data, as well as to control screens, tools, or application screens. A method for applying scope to a set of data and representing the data on a UI in a manner which provides a readily visible indication of the amount of data in the data set and which provides for the prominent presentation of that data which may be most useful to the user is also provided.

Description

CROSS-REFERENCE TO RELATED APPLICATIONS [0001] Not applicable. STATEMENT REGARDING FEDERALLY SPONSORED RESEARCH OR DEVELOPMENT [0002] Not applicable. TECHNICAL FIELD [0003] The present invention relates to computing environments. More particularly, the present invention relates to a user control for dynamically adjusting the scope of a set of content, information, and / or data and a user interface for representing the same. The present invention further relates to a method for applying scope control to a set of data and representing the data on a user interface in a manner which provides a readily visible indication of the amount of data in the data set and which provides for the prominent presentation of that data which may be most useful to the user. BACKGROUND OF THE INVENTION [0004] As high speed computer networks extend beyond physical boundaries (e.g., work, home, etc.) to encompass the vast network space that is represented by the Internet, locating and bounding information, c...

Claims


Application Information

Patent Timeline
IPC IPC(8): G06F3/048G06F3/0481G06F17/30
CPCG06F17/30775G06F17/30749G06F16/68G06F16/64G06F3/00
Inventor GOLDTHWAITE, FLORA P.CLUTS, JONATHAN C.BLANCO, VICTOR K.
Owner MICROSOFT TECH LICENSING LLC
Learn More