Micropressors, devices and methods for use in analyte monitoring systems

a micropressor and monitoring system technology, applied in the field of micropressors, devices and methods for use in analyte monitoring systems, can solve the problems of reducing the sensitivity of enzyme reaction-based biosensor data, affecting the accuracy of enzyme reaction data, and kinetic-based methods that do little to improve the sensitivity at high concentrations of substrates. the effect of reducing lag times and improving accuracy

Active Publication Date: 2006-04-06
ANIMAS TECH +1
View PDF20 Cites 275 Cited by
  • Summary
  • Abstract
  • Description
  • Claims
  • Application Information

AI Technical Summary

Benefits of technology

[0010] The present invention relates to one or more microprocessors comprising programming to control methods described herein; analyte monitoring systems comprising these one or more microprocessors; and the methods themselves which include, but are not limited to, methods for compensating for signal decay, for reducing lag times, for extending usability, for improving accuracy, for reducing noise, for reducing skipped signals, and for improving efficiency. Further, the present invention relates to algorithms for improved optimization of parameters for use in prediction models that require optimization of adjustable parameters.

Problems solved by technology

Similar problems have been encountered in conventional kinetic-based methods when they are applied to enzymatic determinations of analytes in homogeneous solutions (Chen, W., et al., Analytica Chimica Acta 388:231-241, 1999).
Engh, et al., (Anal. Chem. 60:545, 1988), used alternative applications of a rate-based approach and showed improvement in the ruggedness of enzymatic methods but also demonstrated that the methods did little to improve the sensitivity at high concentrations of substrate.
Although some improvements in performance characteristics of the enzyme reaction-based biosensor were observed, both methods were shown to have limitations when applied to enzyme reaction-based biosensor data.
In analyte monitoring devices that employ an electrochemical sensor, signal decay over time can be a significant problem.
However, even current MOE methods only compensate to some extent for signal decay.
Typically, standard MOE compensation becomes insufficient, for example, towards the end of long monitoring periods.

Method used


Image

  • Micropressors, devices and methods for use in analyte monitoring systems
  • Micropressors, devices and methods for use in analyte monitoring systems
  • Micropressors, devices and methods for use in analyte monitoring systems

Examples


example 1

Discussion of the PK and 7-Minutes Integration Methods

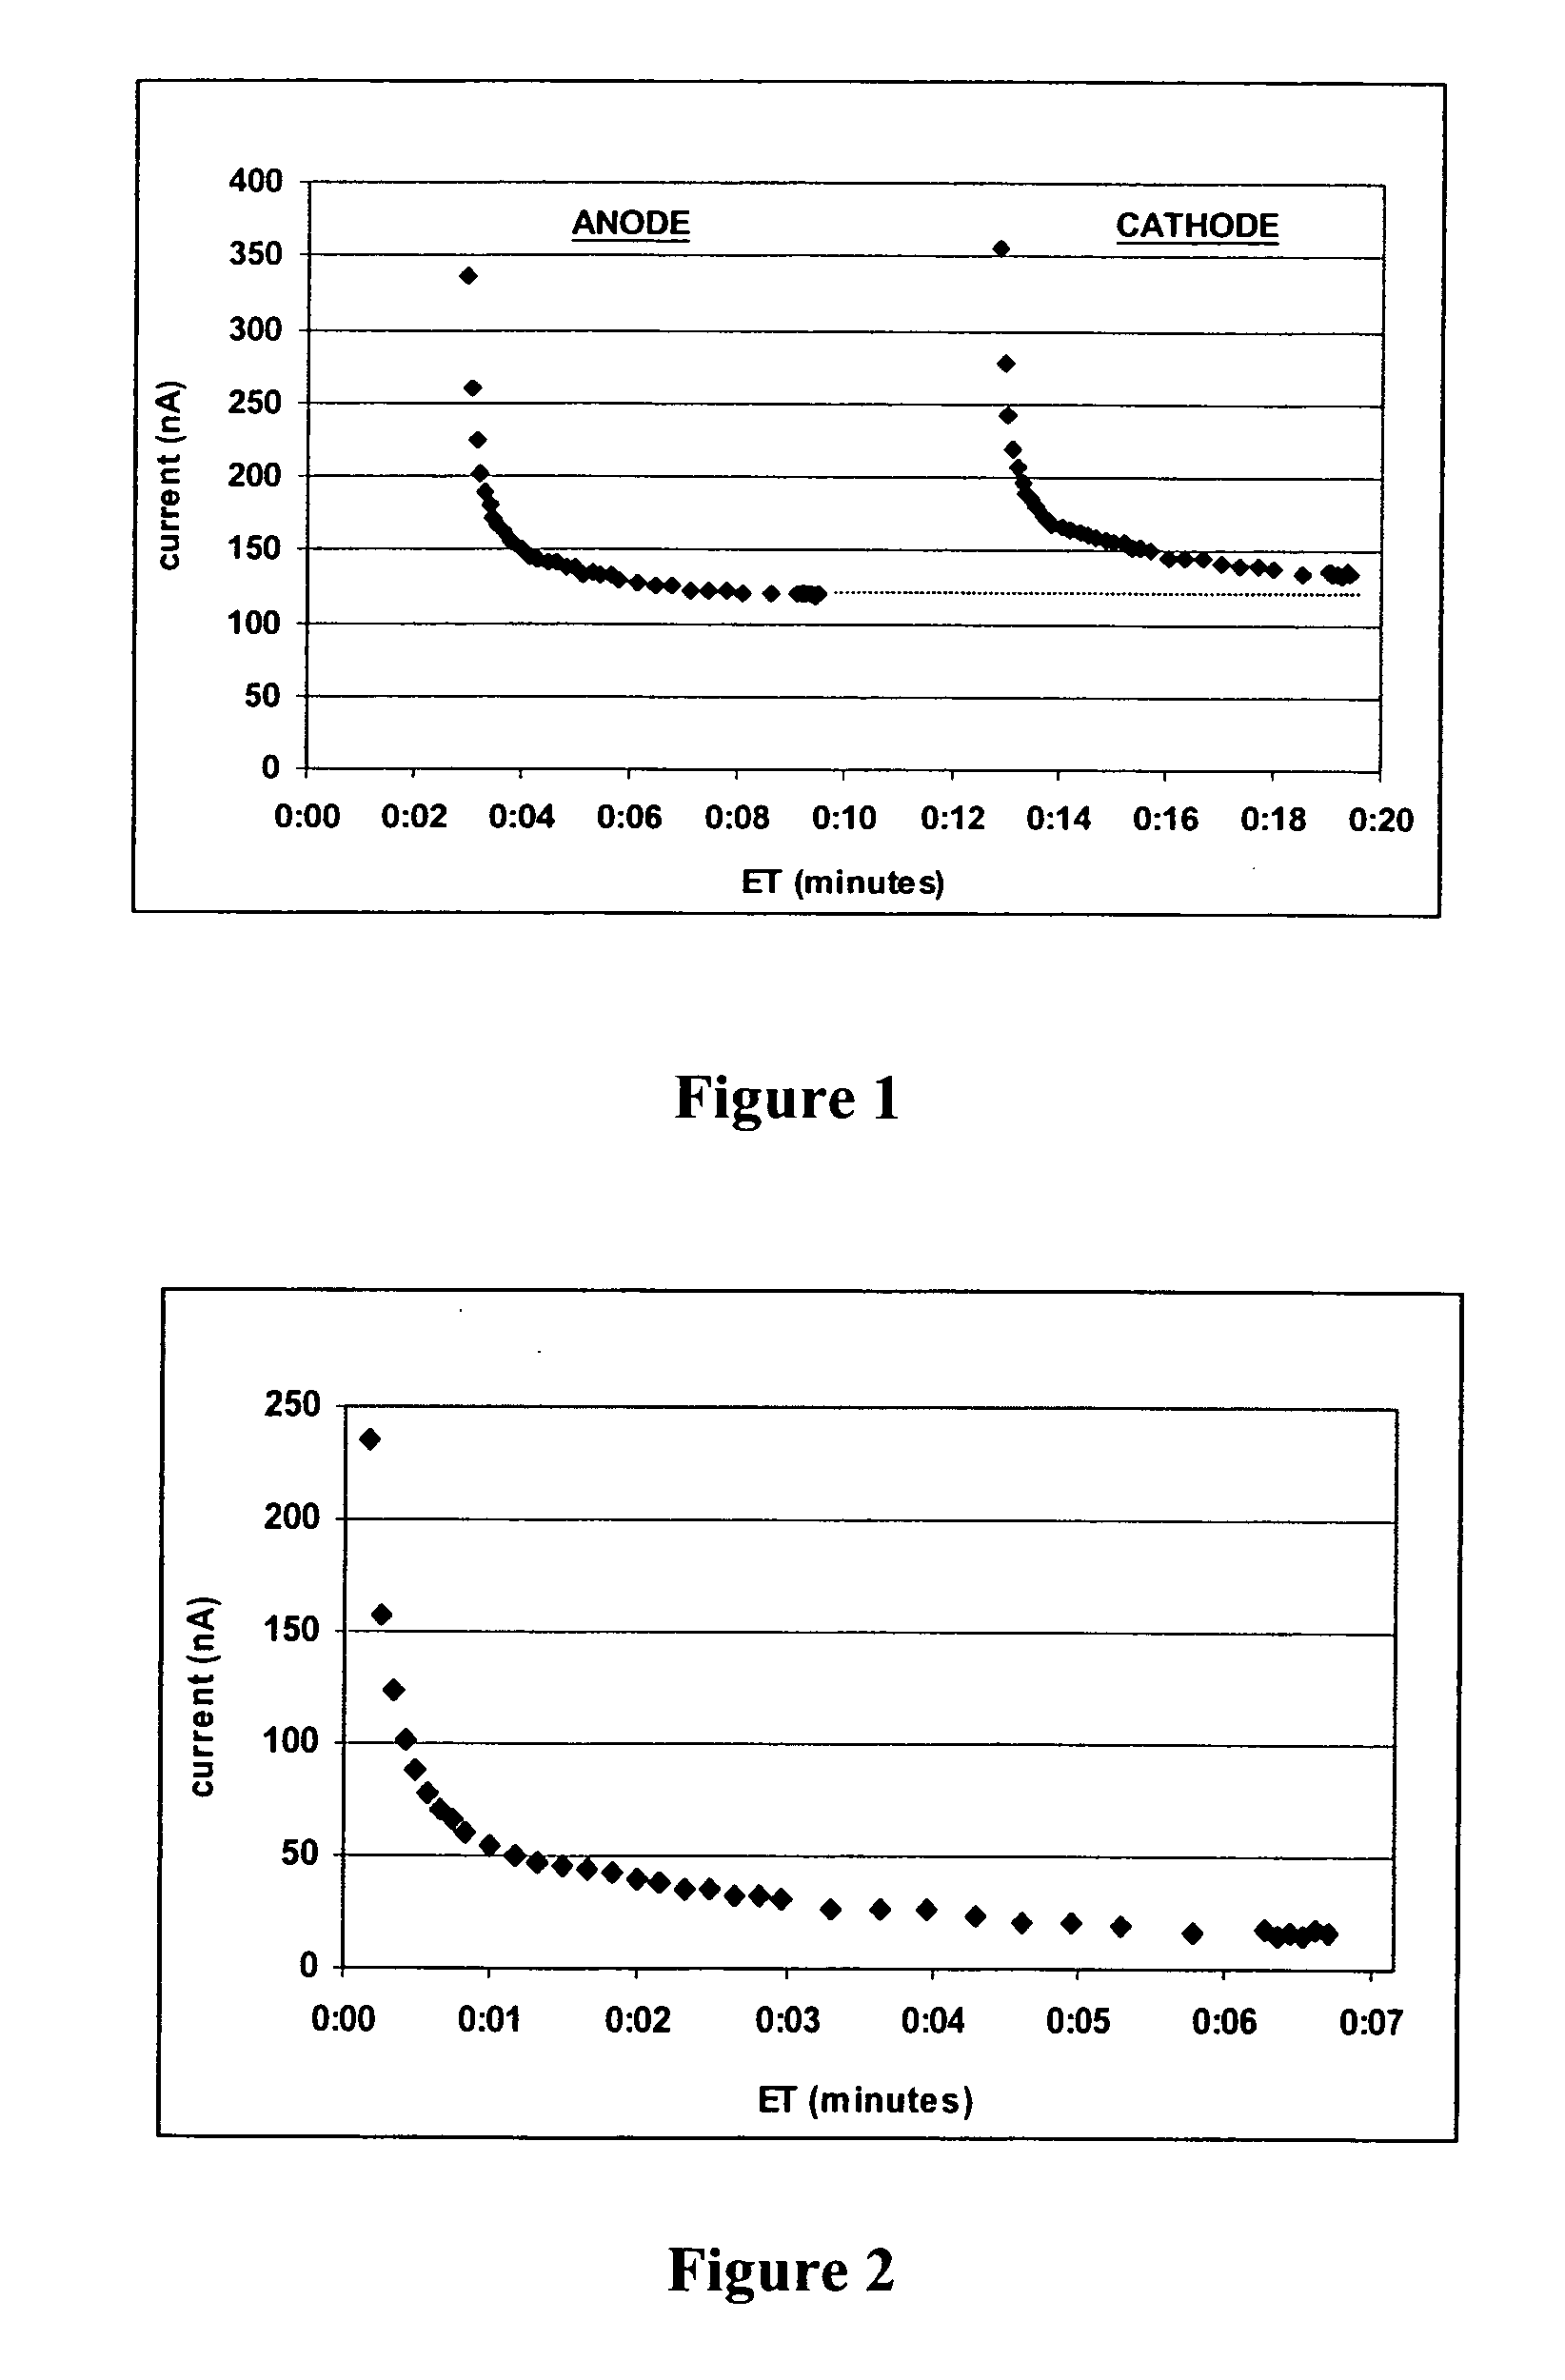
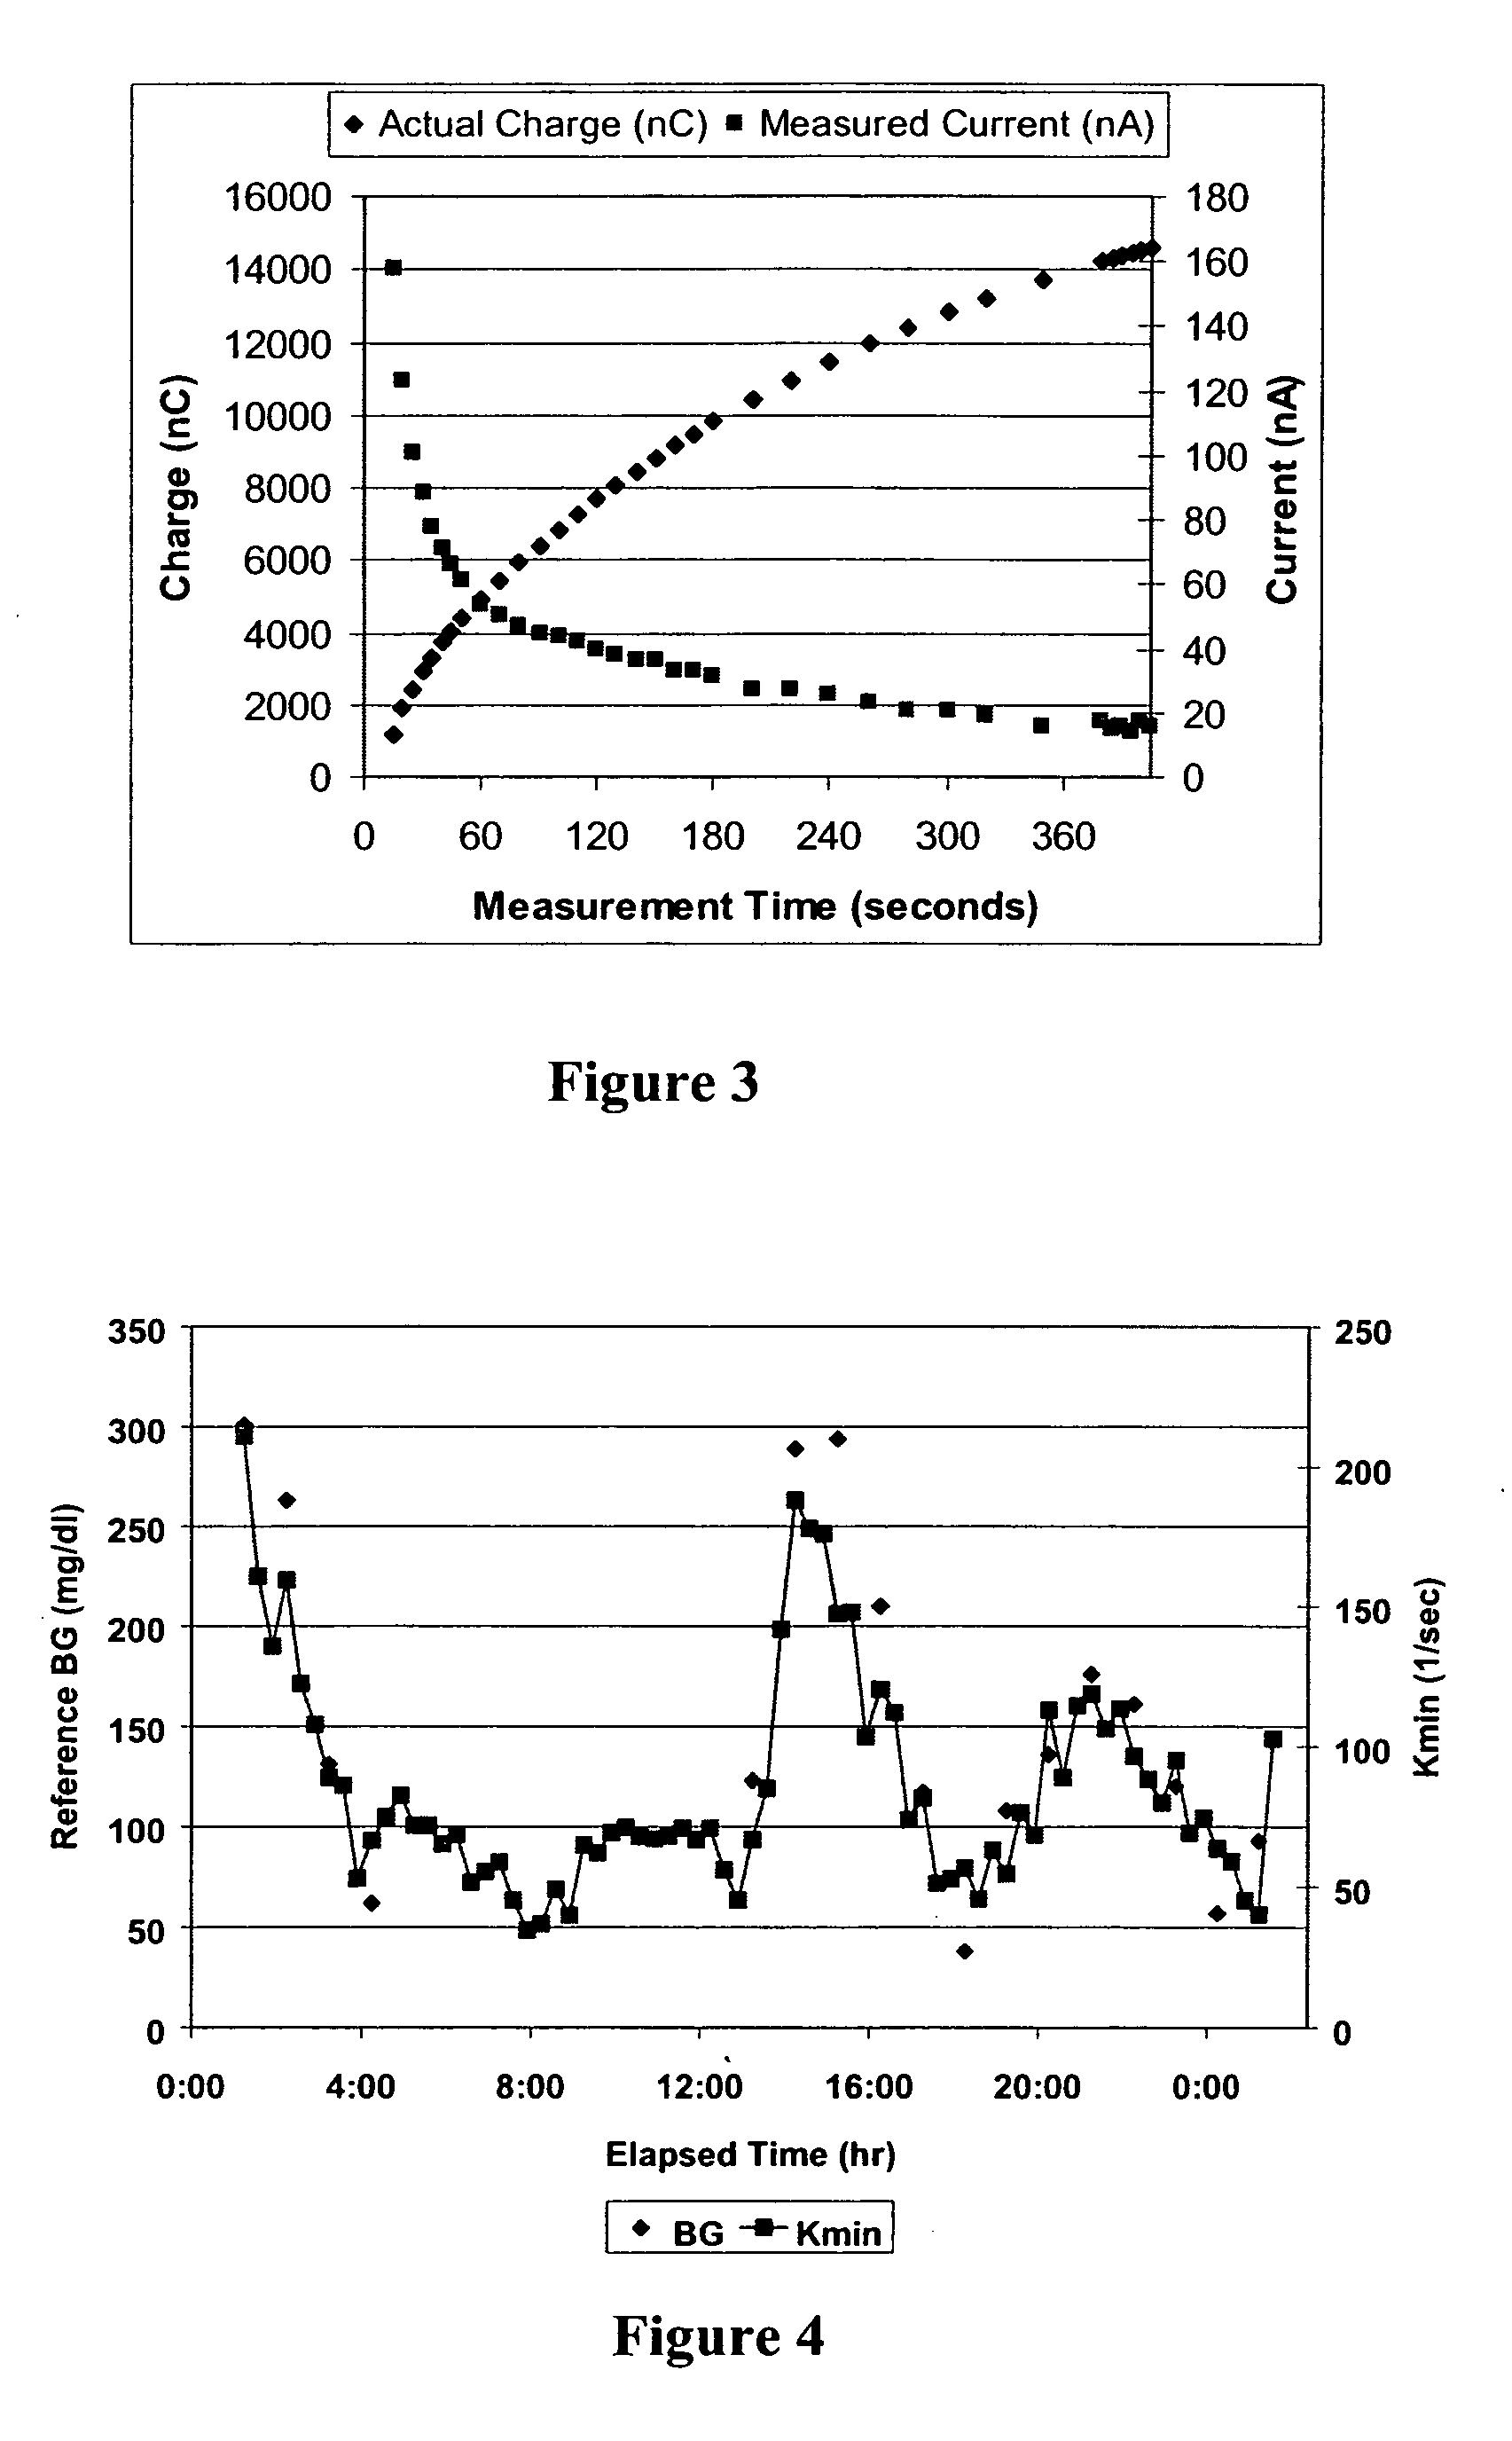
[0318] Data were collected using GlucoWatch biographers on human subjects. The electrode response to the glucose was monitored. The current responses were then transferred to a computer for data processing. The subjects were monitored for approximately 26 hours. Briefly, samples comprising glucose were transdermally extracted from the subject using a GlucoWatch biographer in operative contact with a skin surface of each subject. Measured current signals were obtained over time. The measured current signals comprised a measured current signal response current curve, from the extracted glucose, wherein the measured current signal is specifically related to the amount of glucose in a hydrogel of a GlucoWatch biographer. After integration, a measured charge signal over time was obtained. The measured charge signal comprised a measured charge signal response curve that was specifically related to the amount (or concentration) of gluc...

example 2

The 1 / k2 Effect

[0324] A typical example of the 1 / k2 effect is shown in FIG. 16(b). In this example, the charge signal was calculated using the 7-minute fixed-point method (FIG. 16, panel a) and 1 / k2 calculated from the 3-min data fit to the PK Eq. (3A) (FIG. 16, panel b), as follows: Q⁡(t)=So+c1k1⁢(1-ⅇ-k1⁢t)+c2k2⁢(1-ⅇ-k2⁢t)(Eq. ⁢3⁢A)

[0325] The fixed point-method values and the 1 / k2 values were plotted together with the reference BG as functions of the elapsed time (ET). Both 7-minute charge signal and the 1 / k2 signal had been converted into glucose readings using simple single-point calibration at 1 hour ET. An exemplary calculation of glucose concentration based on charge signal is as follows: [Glu]t=[Glu]calnCcal⁢(nC⁡(from⁢ ⁢7⁢ ⁢min⁢ ⁢signal))t

where Glut is the glucose concentration at time t, Glucal is the glucose concentration at the time of calibration that corresponds to nCcal, the nC charge (integral of current) at the time of calibration, and (nC 7 min signal)t is the nC...

example 3

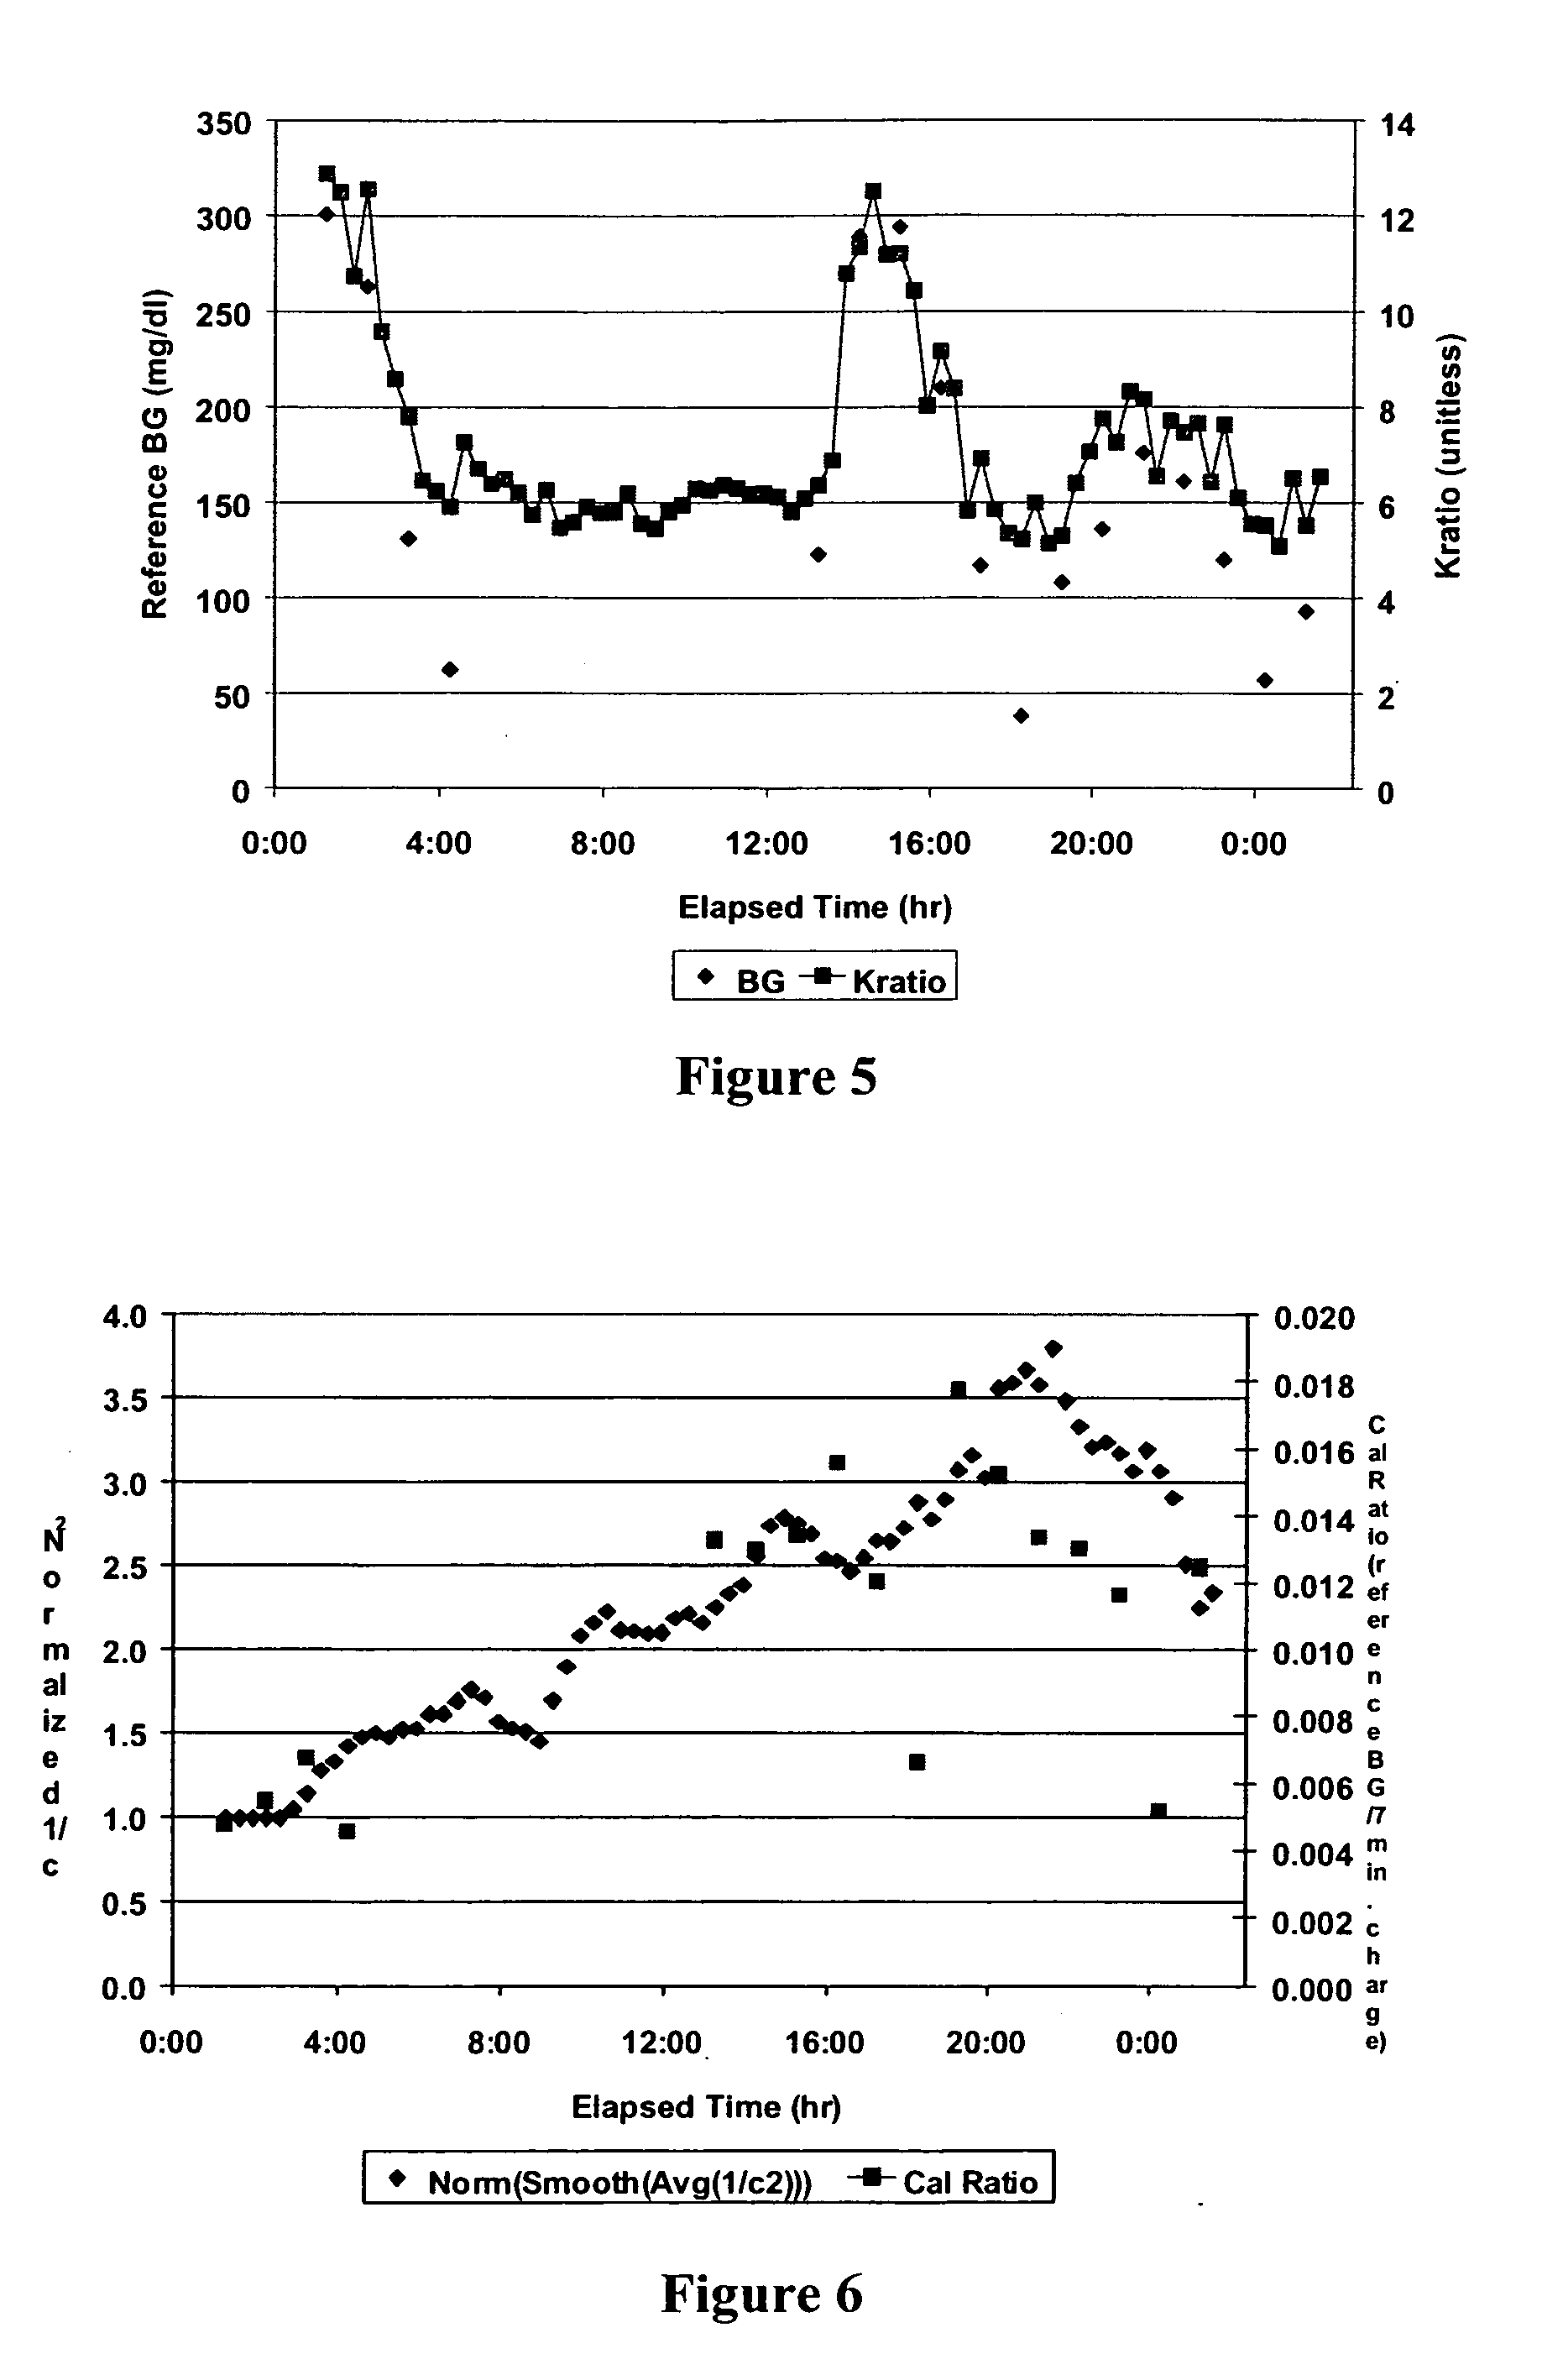
Analysis of the Correlation of Kmin and Kratio to Analyte Amount or Concentration

[0329] In order to confirm the obvious visual observations exemplified in FIG. 16 in a more quantitative way, the data from 119 GlucoWatch biographers was analyzed.

[0330] Both Kmin and Kratio analyses were performed on data sets from 1 19 GlucoWatch biographers that had been applied to human subjects. The same execution steps were followed to calculate {c1, c2, k1, and k2} values for each cathode cycle. Then Kmin and Kratio analysis were calculated and paired with reference BG values.

[0331] Because each estimate (i.e., fitted parameter) had different units, a one point calibration was done at Elapsed Time (ET) 1:14 (or first available reference BG) and estimated glucose values were converted into same unit (mg / dl). The parameters c1, c2, k1, and k2 were estimated using the following equation fitted to the first three minutes of signal charge data at each time point: Q⁡(t)=So+c1k1⁢(1-ⅇ-k1⁢t)+c2k2⁢(1-...


PUM

PropertyMeasurementUnit
timeaaaaaaaaaa
monitoring timeaaaaaaaaaa
currentaaaaaaaaaa

Abstract

The present invention comprises one or more microprocessors programmed to execute methods for improving the performance of an analyte monitoring device including prediction of glucose levels in a subject by utilizing a predicted slower-time constant (1 / k2). In another aspect of the invention, pre-exponential terms (1 / c2) can be used to provide a correction for signal decay (e.g., a Gain Factor). In other aspects, the present invention relates to one or more microprocessors comprising programming to control execution of (i) methods for conditional screening of data points to reduce skipped measurements, (ii) methods for qualifying interpolated / extrapolated analyte measurement values, (iii) various integration methods to obtain maximum integrals of analyte-related signals, as well as analyte monitoring devices comprising such microprocessors. Further, the present invention relates to algorithms for improved optimization of parameters for use in prediction models that require optimization of adjustable parameters.

Description

CROSS-REFERENCE TO RELATED APPLICATIONS [0001] This application is a Divisional of U.S. application Ser. No. 10 / 394,516, filed Mar. 21, 2003, and claims the benefit of priority to U.S. Provisional Patent Application No. 60 / 367,087, filed Mar. 22, 2002 and U.S. Provisional Application No. 60 / 413,989, filed Sep. 25, 2002, the contents of which are incorporated herein by reference.TECHNICAL FIELD [0002] The present invention includes, but is not limited to, one or more microprocessors comprising programming to control execution of methods for improving the performance of an analyte monitoring system that provides a series of analyte-related signals over time; one or more microprocessors programmed to execute the methods and control a sensing device; one or more microprocessors programmed to execute the methods, control a sensing device, and control a sampling device; monitoring systems employing the methods of the present invention; and the methods themselves; as well as algorithms for...

Claims


Application Information

Patent Timeline
Patent Type & Authority Applications(United States)
IPC IPC(8): G06F19/00G01N27/26A61B5/00A61B5/053A61B5/145A61B5/1477G01N27/28G01N27/327G01N27/416G01N33/487
CPCA61B5/0531A61B5/14532Y10T436/144444G01N27/3271A61B5/7242A61B5/681
Inventor BARTKOWIAK, MIROSLAWHARPER, WESLEY S.KULCU, ERAYLESHO, MATTHEW J.TAMADA, JANET A.
Owner ANIMAS TECH
Why Eureka
Try Eureka