
Method for increasing the dynamic range of a cavity enhanced optical spectrometer

a technology of enhanced optical spectrometer and dynamic range, which is applied in the direction of instruments, color/spectral properties measurement, material analysis, etc., can solve the problems of inability to accurately measure the absolute absorption signal, limited instrument capability, and inability to fluctuate sensitivity

Inactive Publication Date: 2006-04-20
PICARRO
View PDF1 Cites 52 Cited by
  • Summary
  • Abstract
  • Description
  • Claims
  • Application Information

AI Technical Summary

Problems solved by technology

At the low analyte concentration end, the transmission of light is adequate to produce a high signal-to-noise ratio at the detector so that sensitivity is limited by fluctuations in the light source intensity.
At the high analyte concentration end, most of the light is absorbed by the sample, so that the instrument capability is limited by detector noise.
Instruments that measure the absorption directly have a large dynamic range, but cannot accurately measure the absolute absorption signal.
None of the above-mentioned existing absorption spectroscopy methods can measure absolute absorption, regardless of whether they utilize incoherent or monochromatic light sources.
Therefore, all of these approaches require calibration.
In practice, it is desirable to ensure that only a single resonator mode has an appreciable amplitude, since excitation of multiple resonator modes leads to multi-exponential radiation intensity decay (i.e., multiple time constants), which significantly complicates the interpretation of measurement results.

Method used


Image

  • Method for increasing the dynamic range of a cavity enhanced optical spectrometer
  • Method for increasing the dynamic range of a cavity enhanced optical spectrometer
  • Method for increasing the dynamic range of a cavity enhanced optical spectrometer

Examples


first embodiment

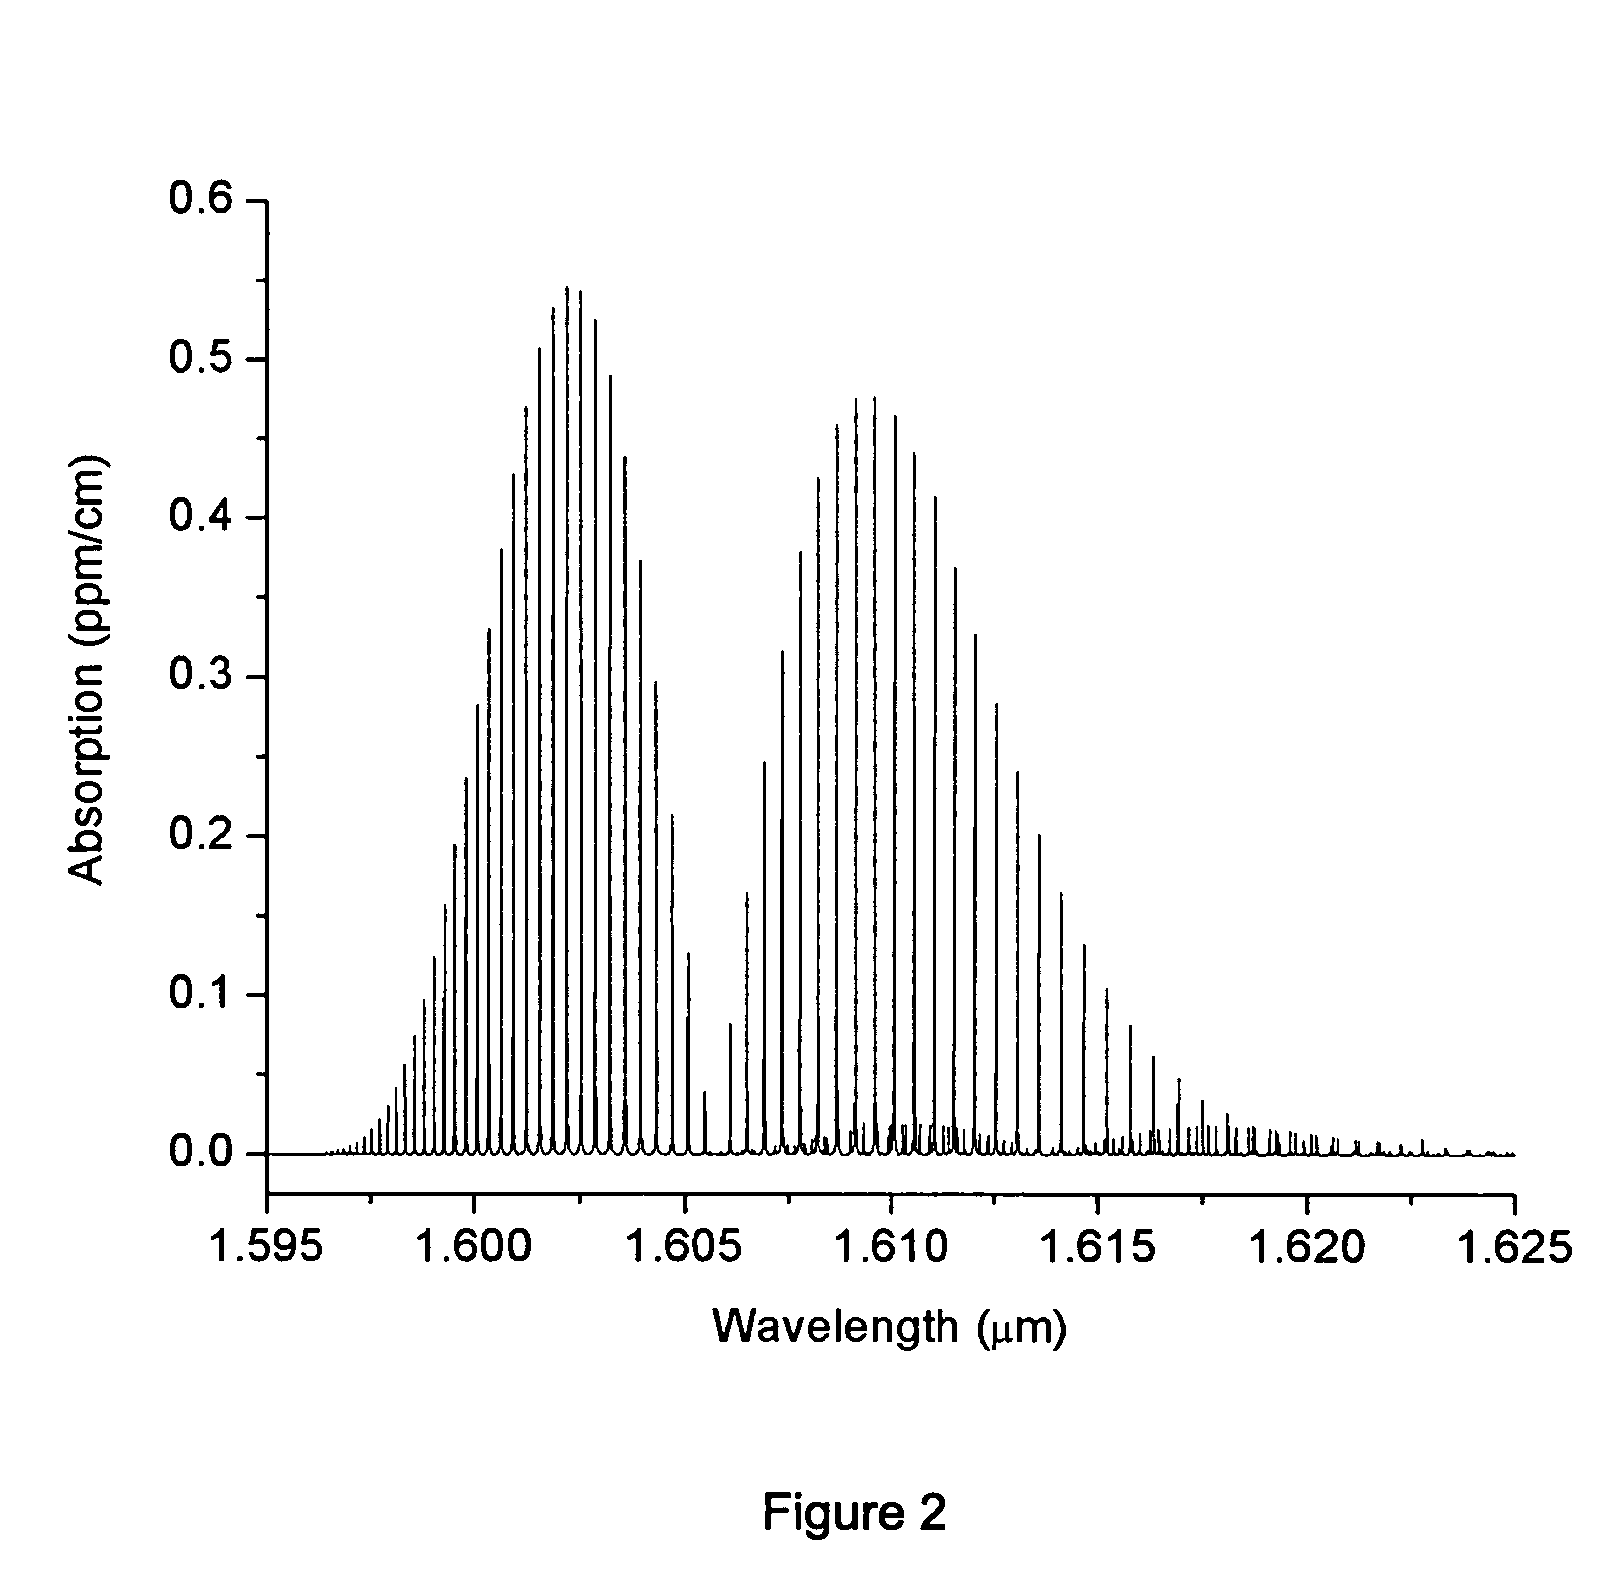
[0058] The process of the present invention encompasses several alternative embodiments for measuring the concentration of one, or in some instances more than one gaseous target analyte present at low concentration. In a first embodiment, the target analyte is present in an admixture with at least one additional gaseous species and is detected using a cavity enhanced optical spectrometer by a process comprising: [0059] i) identifying from the spectrum of the pure target analyte a series of absorption peaks, each member of said series being at the spectrometer operating pressure: a) present in the wavelength emission range of said spectrometer, and b) within said emission range free from spectral interference by peaks of any of said additional gaseous species, the first member of the series being the strongest spectral absorption peak of said target analyte [0060] ii) identifying one or more successive peaks of the series which have an absorption that is weaker than the immediately p...

second embodiment

[0063] the present invention provides a process for measuring the concentrations of at least two gaseous target analyte species present in a gaseous admixture comprising at least two different chemical compounds or at least two different isotopomers of the same chemical compound using a cavity enhanced optical spectrometer, the process comprising: [0064] i) identifying a spectral absorption peak for each said target analyte species which peaks are: a) present in the wavelength emission range of said spectrometer, and b) are free from spectral interference at the spectrometer operating pressure by peaks of any of the other compounds or isotopomers present in said admixture, and whereby the height of each of the identified absorption peaks is within a factor of 10 of the height of the other identified peaks, [0065] ii) performing a spectral scan at the wavelength of each of the peaks identified in step i), and [0066] iii) calculating the concentration of each target analyte species fr...


PUM

PropertyMeasurementUnit
wavelength rangeaaaaaaaaaa
reflectivityaaaaaaaaaa

Abstract

Target analytes present in low concentration as components in a gaseous admixture can be detected using a cavity enhanced optical spectrometer by a process comprising: i) identifying from the spectrum of the pure target analyte a series of absorption peaks free from spectral interference by peaks of any additional gaseous species which are present, the first member of the series being the strongest spectral absorption peak of said target analyte ii) identifying one or more successive peaks of the series which have an absorption that is weaker than the immediately previously identified peak of the series, iii) performing a spectral scan at the wavelengths of the peaks identified in steps i) and ii), and iv) calculating the concentration of the target analyte from the spectral scan of the admixture performed at the wavelength determined in step iii).

Description

FIELD OF THE INVENTION [0001] This invention relates to a method for increasing the measurable concentration range (dynamic range) of a cavity enhanced optical spectrometer which can be either a cavity ringdown spectrometer (CRDS) or a cavity enhanced absorption spectrometer (CEAS) which is sometimes called an integrated cavity output spectrometer (ICOS) by analyzing selected strong and weak absorption bands of a target analyte. BACKGROUND OF THE INVENTION [0002] Molecular absorption spectroscopy is a technique that uses the interaction of energy with a molecular species to qualitatively and / or quantitatively study the species, or to study physical processes associated with the species. The interaction of radiation with matter can cause redirection of the radiation and / or transitions between the energy levels of the atoms or molecules. The transition from a lower level to a higher level with an accompanying transfer of energy from the radiation field to the atom or molecule is calle...

Claims


Application Information

Patent Timeline
Patent Type & Authority Applications(United States)
IPC IPC(8): G01N24/00
CPCG01N21/3504G01N21/39G01N2021/391
Inventor PALDUS, BARBARARICHMAN, BRUCEKACHANOV, ALEXANDERCROSSON, ERIC
Owner PICARRO
Learn More