

Optical fiber
- Summary
- Abstract
- Description
- Claims
- Application Information
AI Technical Summary
Benefits of technology
Problems solved by technology
Method used
Image

Examples
first embodiment
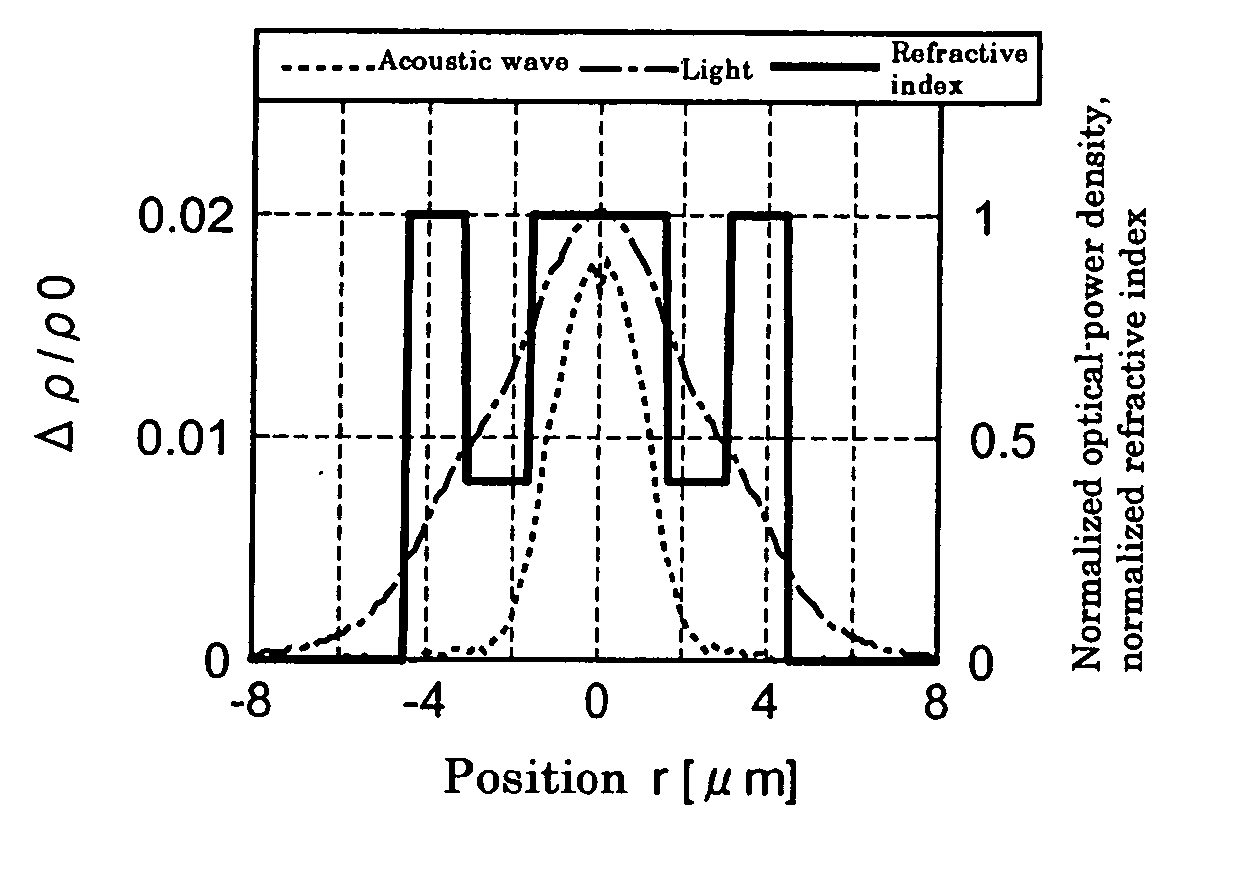
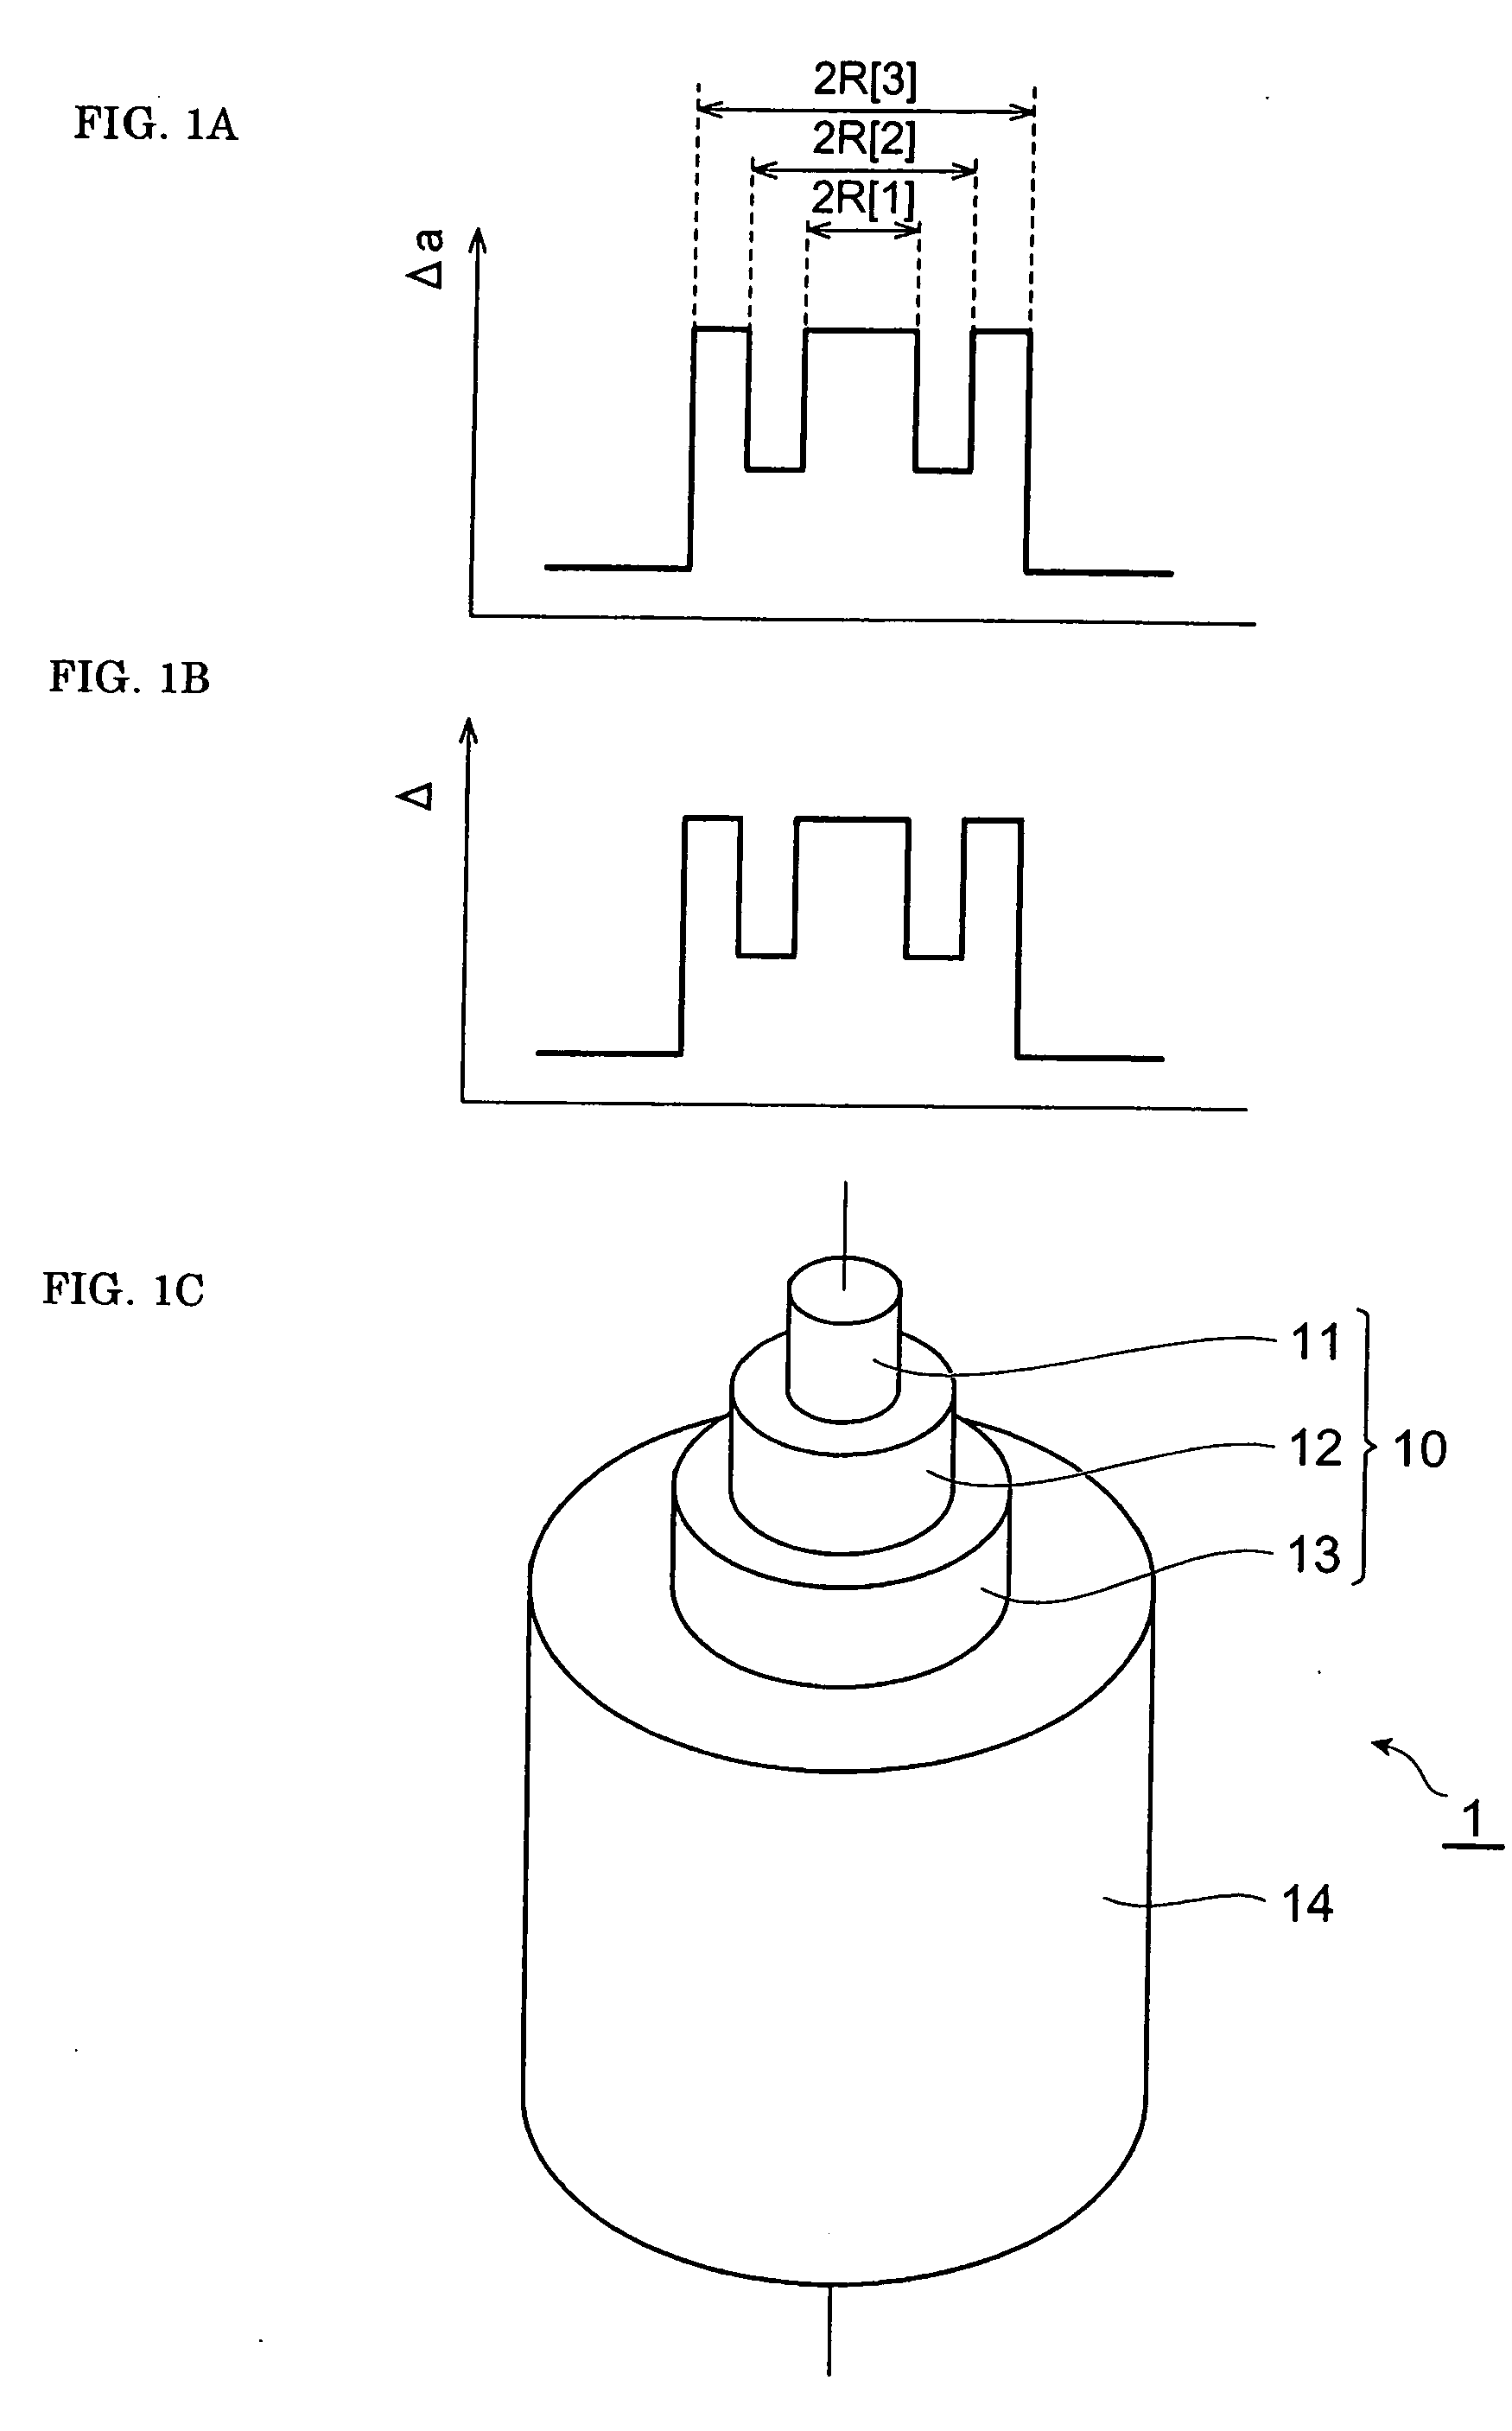
[0042]FIGS. 1A to 1C are graphs and a diagram for explaining an optical fiber 1 of a first embodiment of the present invention. FIG. 1A is a graph showing a radial distribution of the relative acoustic refractive-index difference Δa. FIG. 1B is a graph showing a radial distribution of the relative refractive-index difference Δ. FIG. 1C is a conceptual diagram showing the structure of the optical fiber. The optical fiber 1 comprises an optical core region 10 including the center axis indicated by alternate long and short dashed lines in FIG. 1 and an optical cladding region 14 surrounding the optical core region 10. The optical core region 10 is composed of a first region 11, a second region 12, and a third region 13 in this order from the inside. The individual regions are placed coaxially around the center axis and stretch along the center axis.
[0043] The average refractive index of the optical core region 10 is higher than the refractive index of the optical cladding region 14. T...
second embodiment
[0085]FIGS. 13A to 13C are graphs and a diagram for explaining an optical fiber 2 of a second embodiment. FIG. 13A is a graph showing a radial distribution of the relative acoustic refractive-index difference Δa, FIG. 13B is a graph showing a radial distribution of the relative refractive-index difference Δ, and FIG. 13C is a conceptual diagram showing the structure of the optical fiber 2. The optical fiber 2 comprises an optical core region 20 including the center axis indicated by alternate long and short dashed lines in FIG. 13C and an optical cladding region 24 surrounding the optical core region 20. The optical core region 20 is composed of a first region 21, a second region 22, and a third region 23 in this order from the inside. The individual regions are placed coaxially around the center axis and stretch along the center axis (FIG. 13C).
[0086] The average refractive index of the optical core region 20 is higher than the refractive index of the optical cladding region 24. T...
PUM
 Abstract
Description
Claims
Application Information