PCR elbow determination by rotational transform after zero slope alignment

a rotational transform and elbow technology, applied in the field of determining the characteristic cycle threshold (ct) or the elbow value in the pcr amplification curve, can solve the problems of difficult optimization, if not impossible, all these methods have severe drawbacks

Active Publication Date: 2006-10-05
ROCHE MOLECULAR SYST INC
View PDF3 Cites 16 Cited by
  • Summary
  • Abstract
  • Description
  • Claims
  • Application Information

AI Technical Summary

Benefits of technology

[0008] The present invention provides novel, efficient methods for determining characteristic transition values such as elbow values in sigmoid or growth-type curv

Problems solved by technology

All of these methods have severe drawbacks.
For example, some methods are very sensitive to outlier (noisy) data, and the AFL value approach does not work well for data sets with high base

Method used


Image

  • PCR elbow determination by rotational transform after zero slope alignment
  • PCR elbow determination by rotational transform after zero slope alignment
  • PCR elbow determination by rotational transform after zero slope alignment

Examples


Embodiment Construction

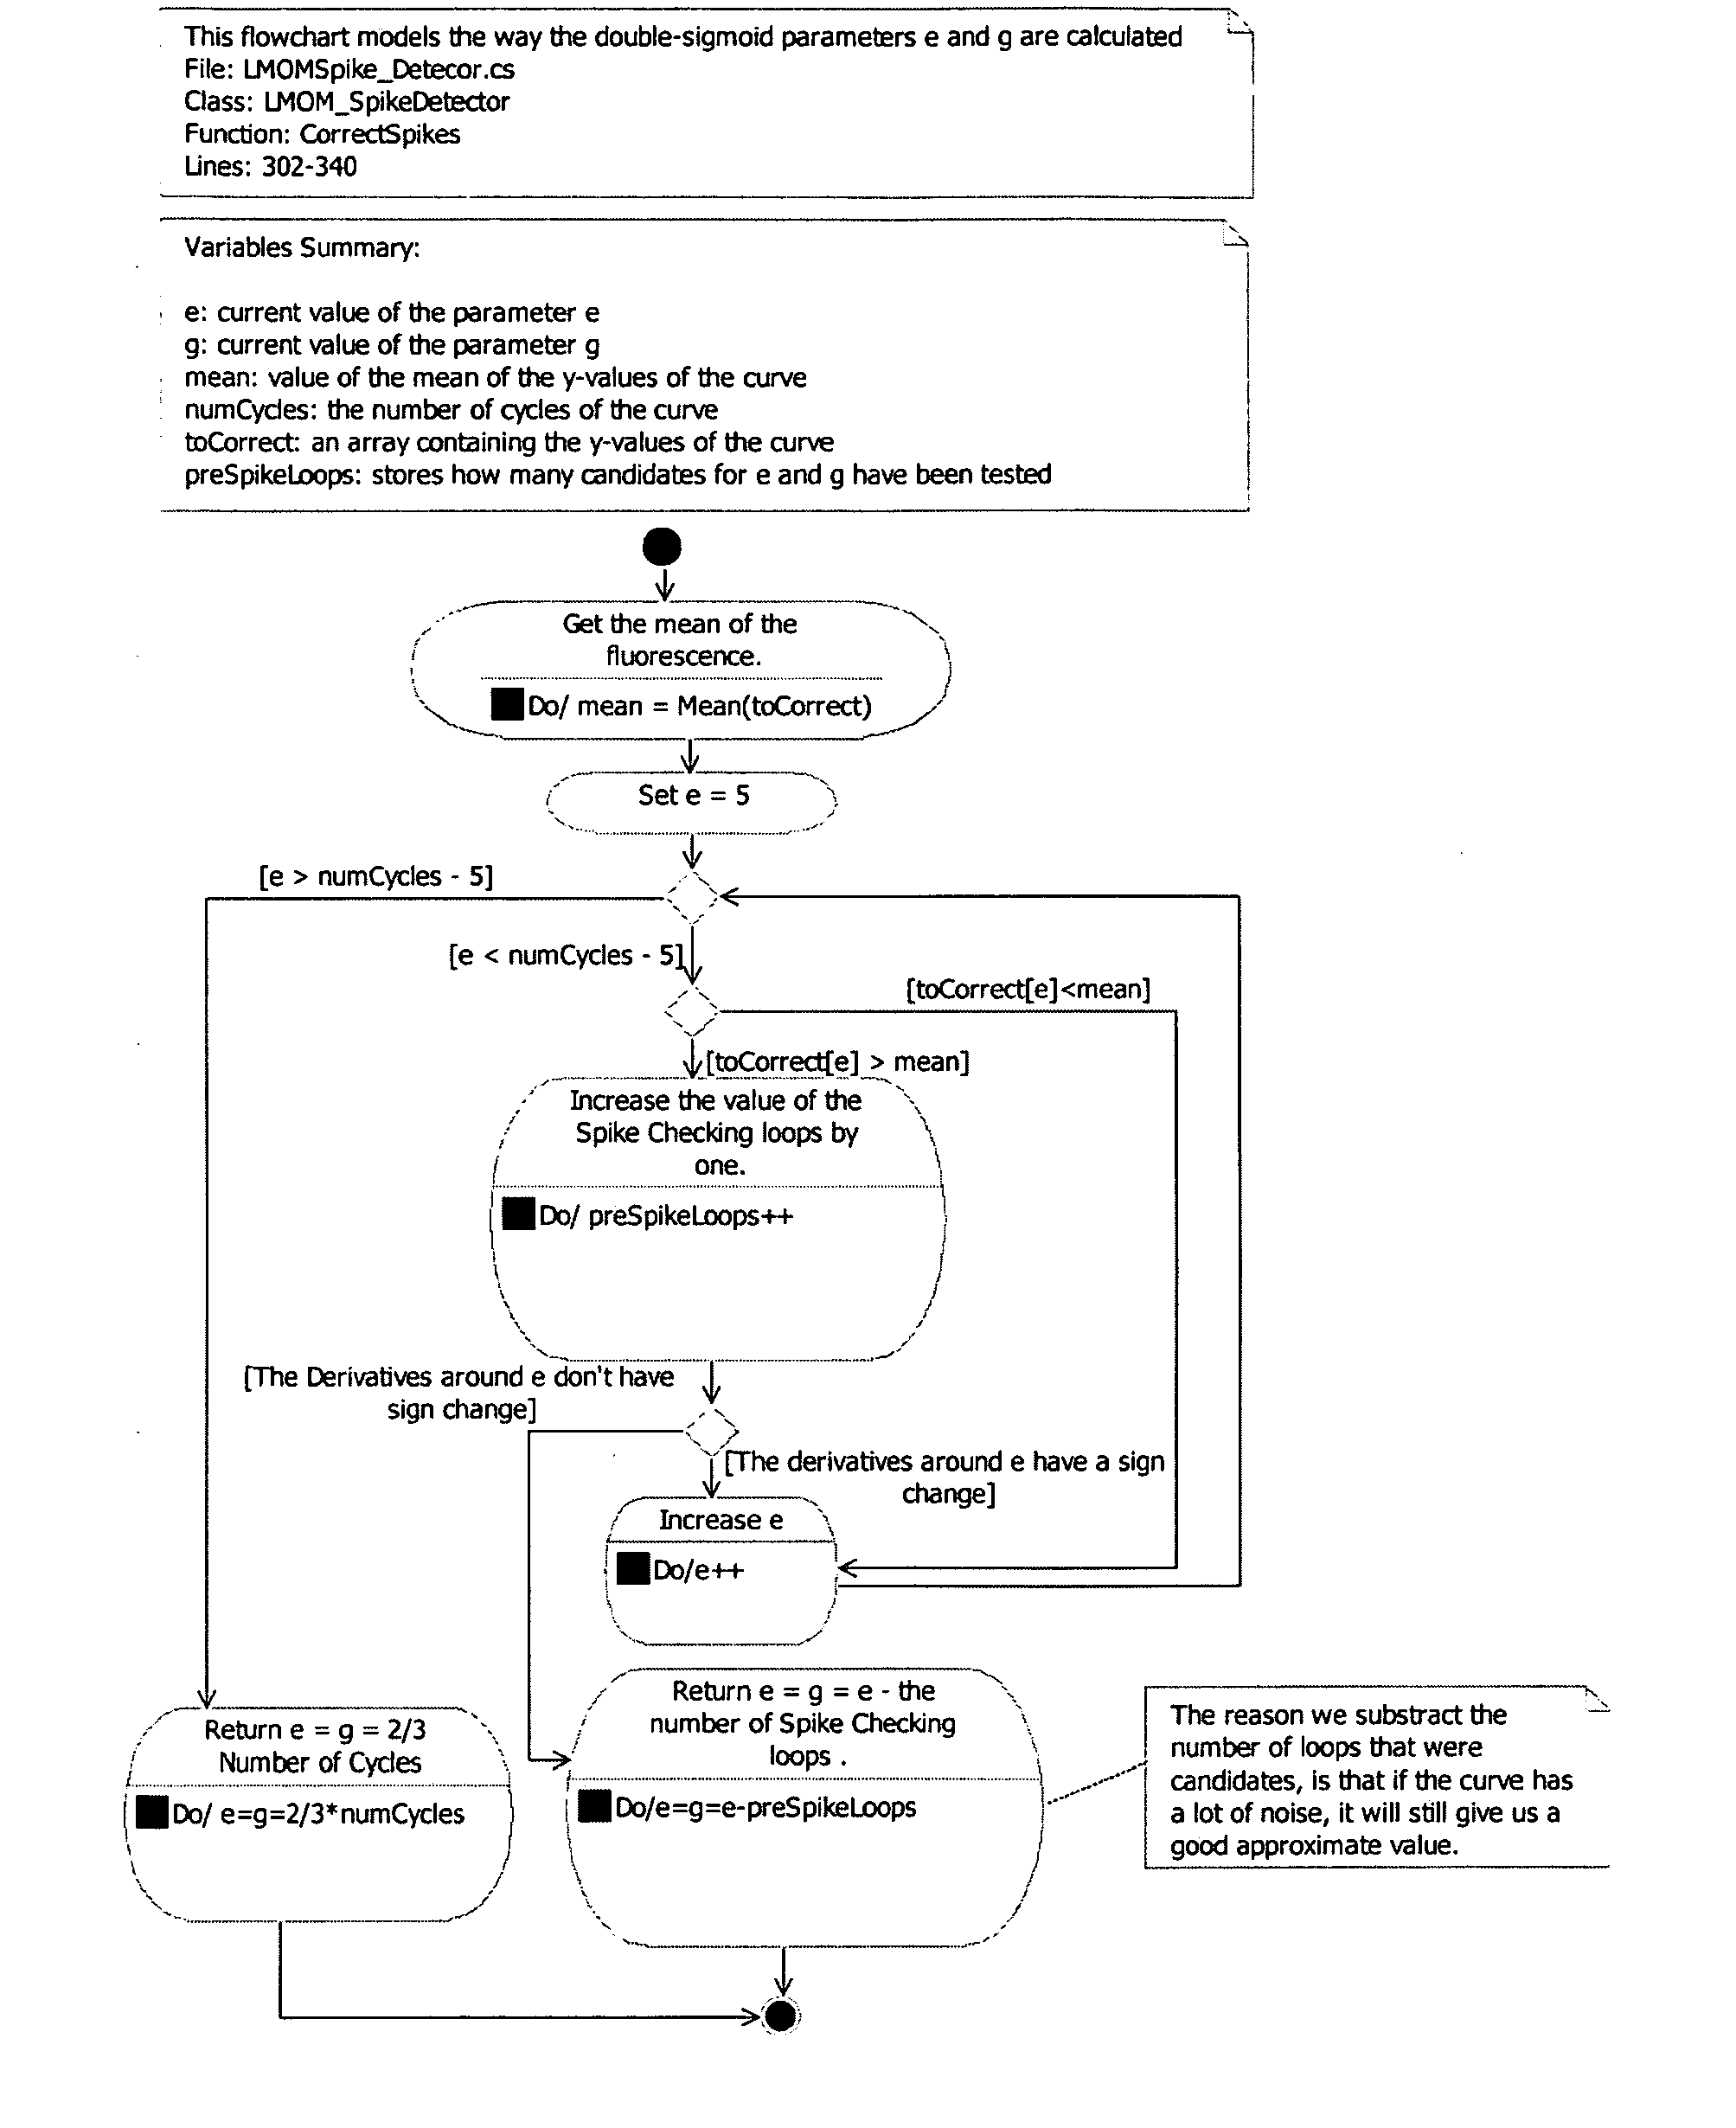
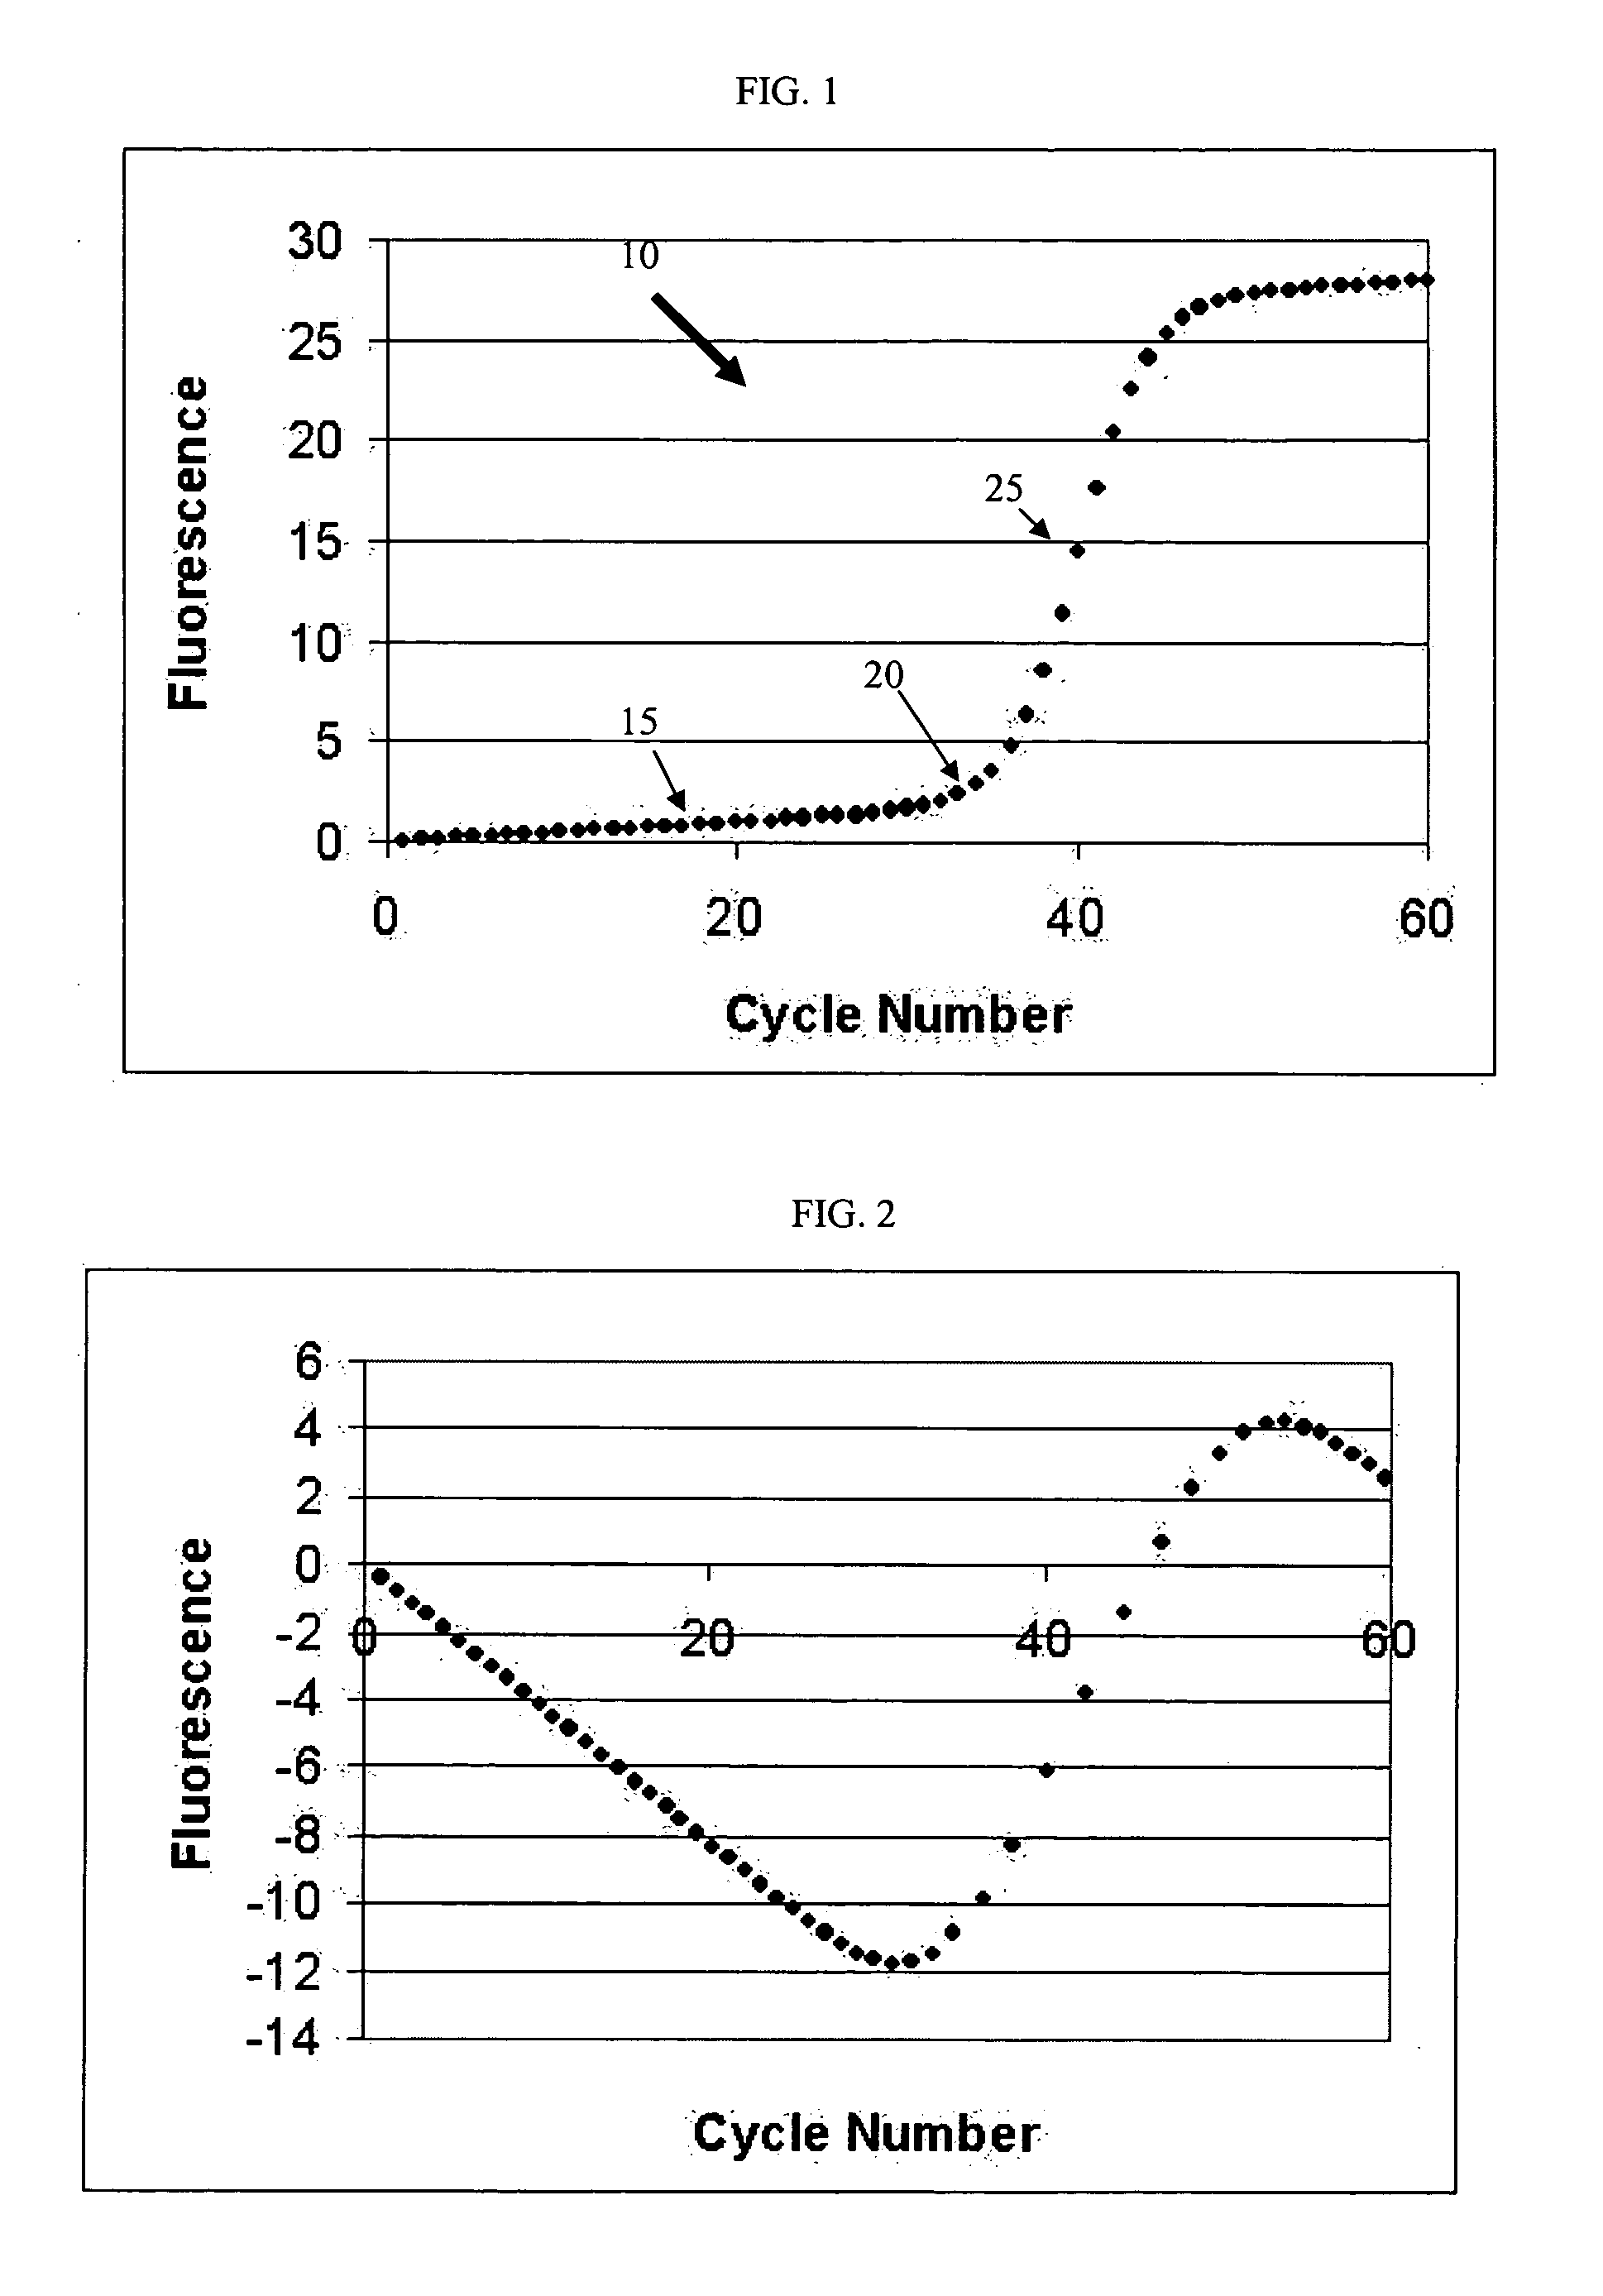
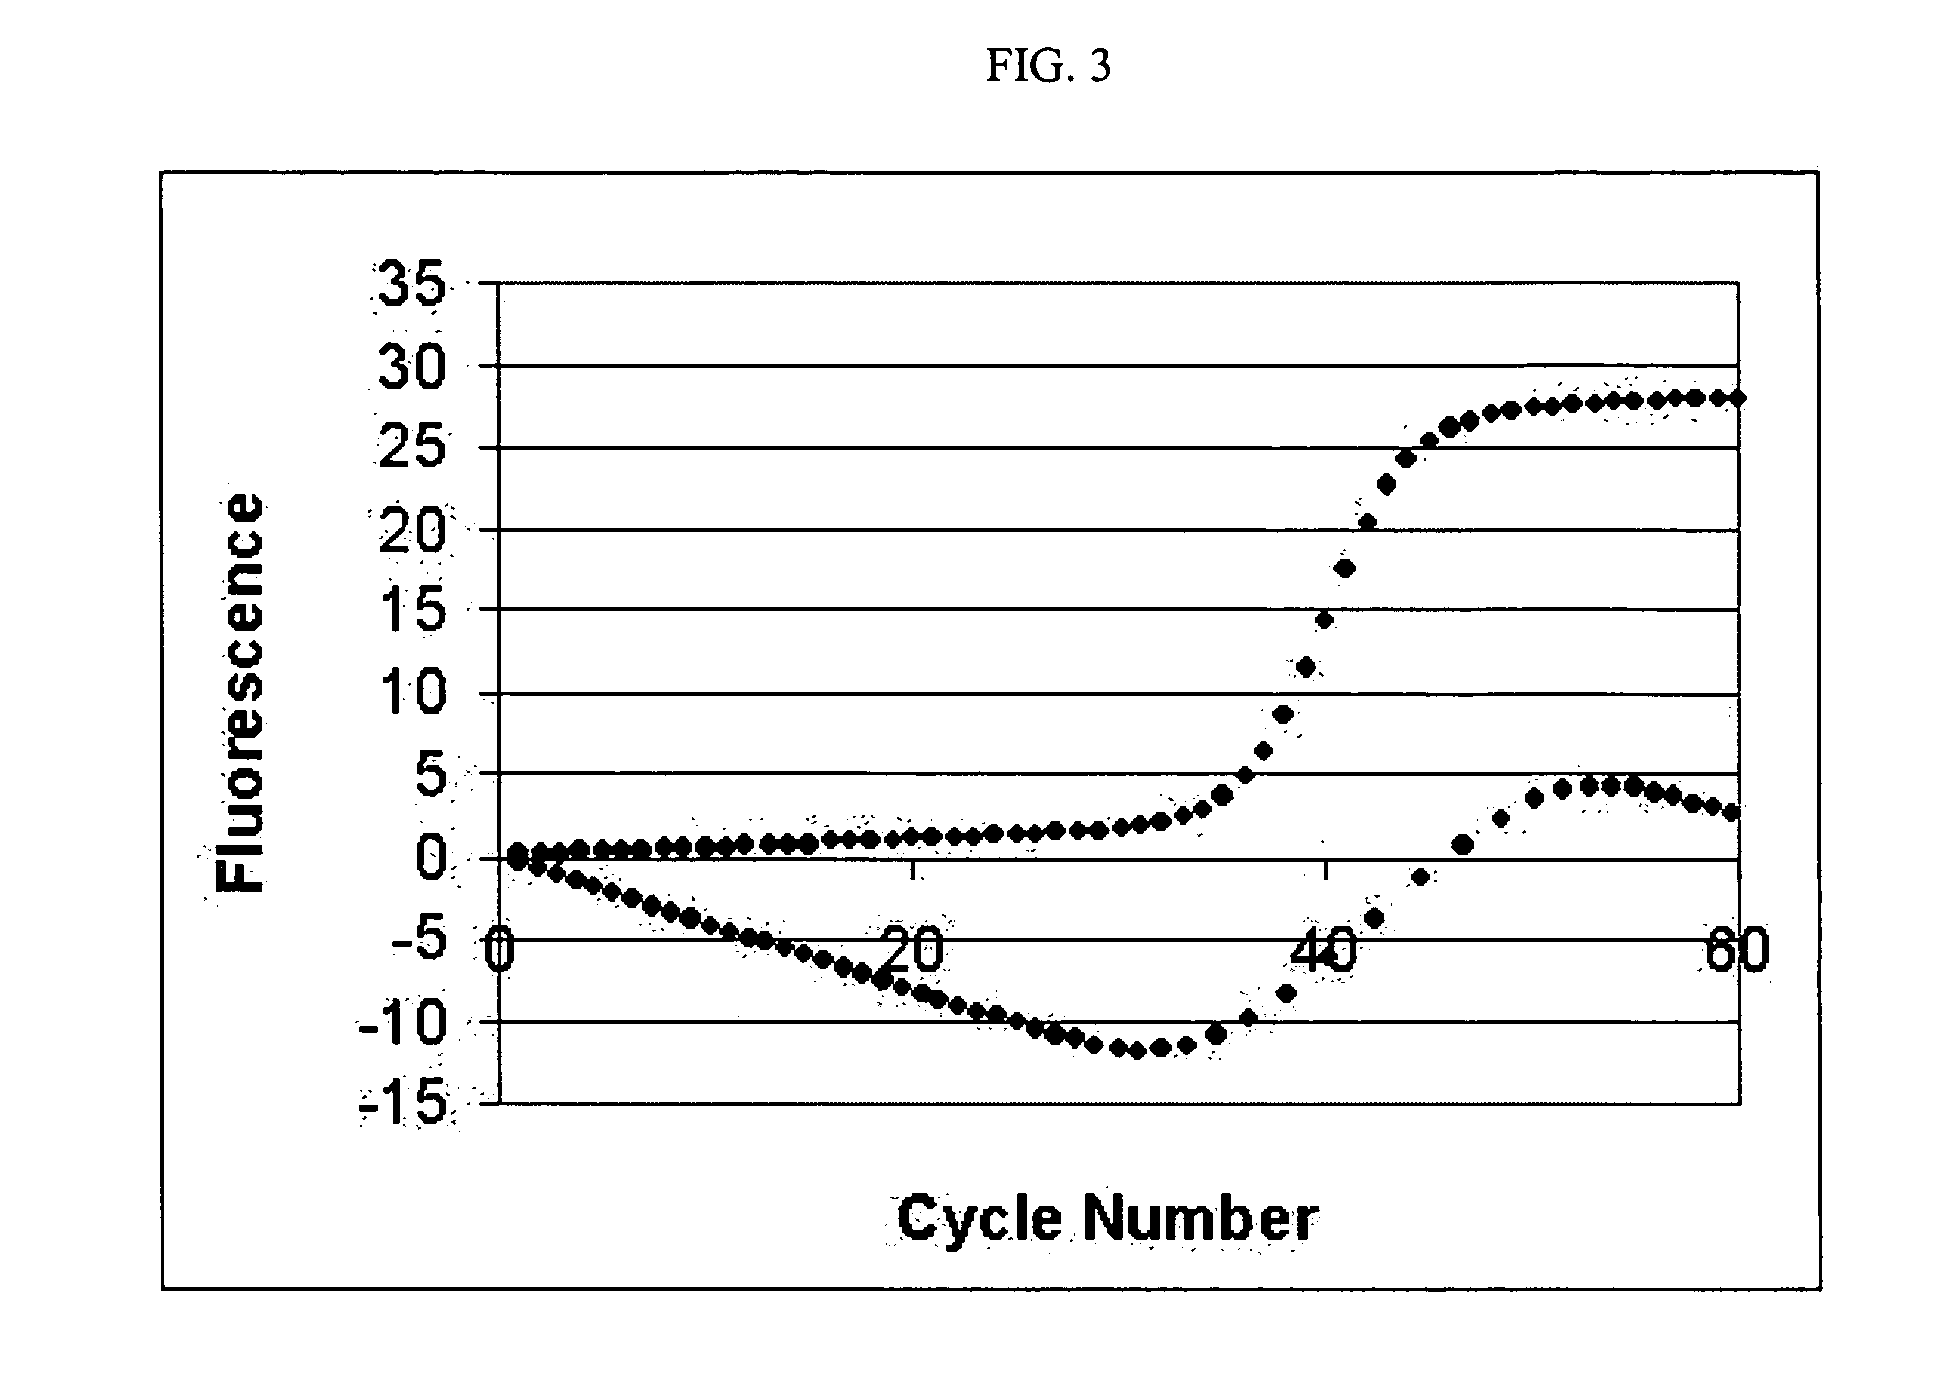
[0035] One example of an amplification curve 10 in the context of a PCR process is shown in FIG. 1. As shown, the curve 10 includes a lag phase region 15, and an exponential phase region 25. Lag phase region 15 is commonly referred to as the baseline or baseline region. Such a curve 10 includes a transitionary region of interest 20 linking the lag phase and the exponential phase regions. Region 20 is commonly referred to as the elbow or elbow region. The elbow region typically defines an end to the baseline and a transition in the growth or amplification rate of the underlying process. Identifying a specific transition point in region 20 can be useful for analyzing the behavior of the underlying process. In a typical PCR curve, identifying a transition point referred to as the elbow value or cycle threshold (Ct) value is extremely useful for understanding efficiency characteristics of the PCR process. Other processes that may provide similar sigrnoid or growth curves include bacteri...


PUM


Abstract

Systems and methods for determining the elbow or Ct value in a real-time, or kinetic, PCR amplification curve data set. A PCR data set may be visualized in a two-dimensional plot of fluorescence intensity vs. cycle number. The data set may be adjusted to have a zero slope. In one aspect, a data set is fit to a double sigmoid curve function with the function parameters determined using a Levenberg-Marquardt regression process. The determined parameters are used to subtract off the linear growth portion from the data set to provide a modified data set. For multiple data sets, all the data curves can be aligned in this manner to have a common baseline slope, e.g., a slope of zero. A rotation transform is applied to a modified data set to rotate the data about a defined coordinate such as the origin so that the data point representing the Ct value becomes a minimum or a maximum along the intensity axis. The data point representing the elbow or Ct value of the curve is identified, and this data point is then rotated back and the cycle number of the data point is returned or displayed.

Description

CROSS-REFERENCES TO RELATED APPLICATIONS [0001] This application is a continuation-in-part (CIP) of U.S. application Ser. No. 11 / 078,692, filed Mar. 11, 2005, titled “Systems and Methods for Determining Real Time PCR Cycle Thresholds Using a Rotation Transformation”, which is hereby incorporated by reference in its entirety.BACKGROUND OF THE INVENTION [0002] The present invention relates generally to systems and methods for processing data representing sigmoid or growth curves, and more particularly to systems and methods for determining characteristic cycle threshold (Ct) or elbow values in PCR amplification curves. [0003] The Polymerase Chain Reaction (PCR) is an in vitro method for enzymatically synthesizing or amplifying defined nucleic acid sequences. The reaction typically uses two oligonucleotide primers that hybridize to opposite strands and flank a template or target DNA sequence that is to be amplified. Elongation of the primers is catalyzed by a heat-stable DNA polymerase...

Claims


Application Information

Patent Timeline
IPC IPC(8): G06F19/00G16B25/20
CPCG06F17/17G06F17/10G16B25/00G16B25/20G06F2218/10
Inventor KURNIK, RONALD T.
Owner ROCHE MOLECULAR SYST INC
Why Eureka
Try Eureka