Method and device for comparative display of biological data

a biological data and comparative display technology, applied in the field of computer systems for visualizing information and data, can solve the problems of inability to meet the speedy process, no possibility of blending out or hiding data points, visual problems for users, etc., and achieve the effect of improving user control over the displayed data and improving graphical representation

Active Publication Date: 2006-12-07
EPPENDORF AG
View PDF3 Cites 4 Cited by
  • Summary
  • Abstract
  • Description
  • Claims
  • Application Information

AI Technical Summary

Benefits of technology

[0010] It is therefore an object of the present invention to provide methods, software tools and systems for improved graphical representation and enhanced user control over the displayed data.

Problems solved by technology

For example, the presence of 1000 data points at a screen resolution of 800×600 pixels will create visual problems to the user in cases where data points are very close to each other or even do overlap.
Furthermore there is no possibility to blend out or hide data points which are not of interest, e.g., those showing the same expression level in both of two samples, by defining certain thresholds for data points to be displayed.
The graphics representation as described in the prior art cannot fulfill a speedy process, does not provide for sophisticated data highlighting / sorting and setting of display threshold values, nor are multiple screens at the same time ensuring proper synchronization of data in quasi real time.

Method used


Image

  • Method and device for comparative display of biological data
  • Method and device for comparative display of biological data
  • Method and device for comparative display of biological data

Examples


Embodiment Construction

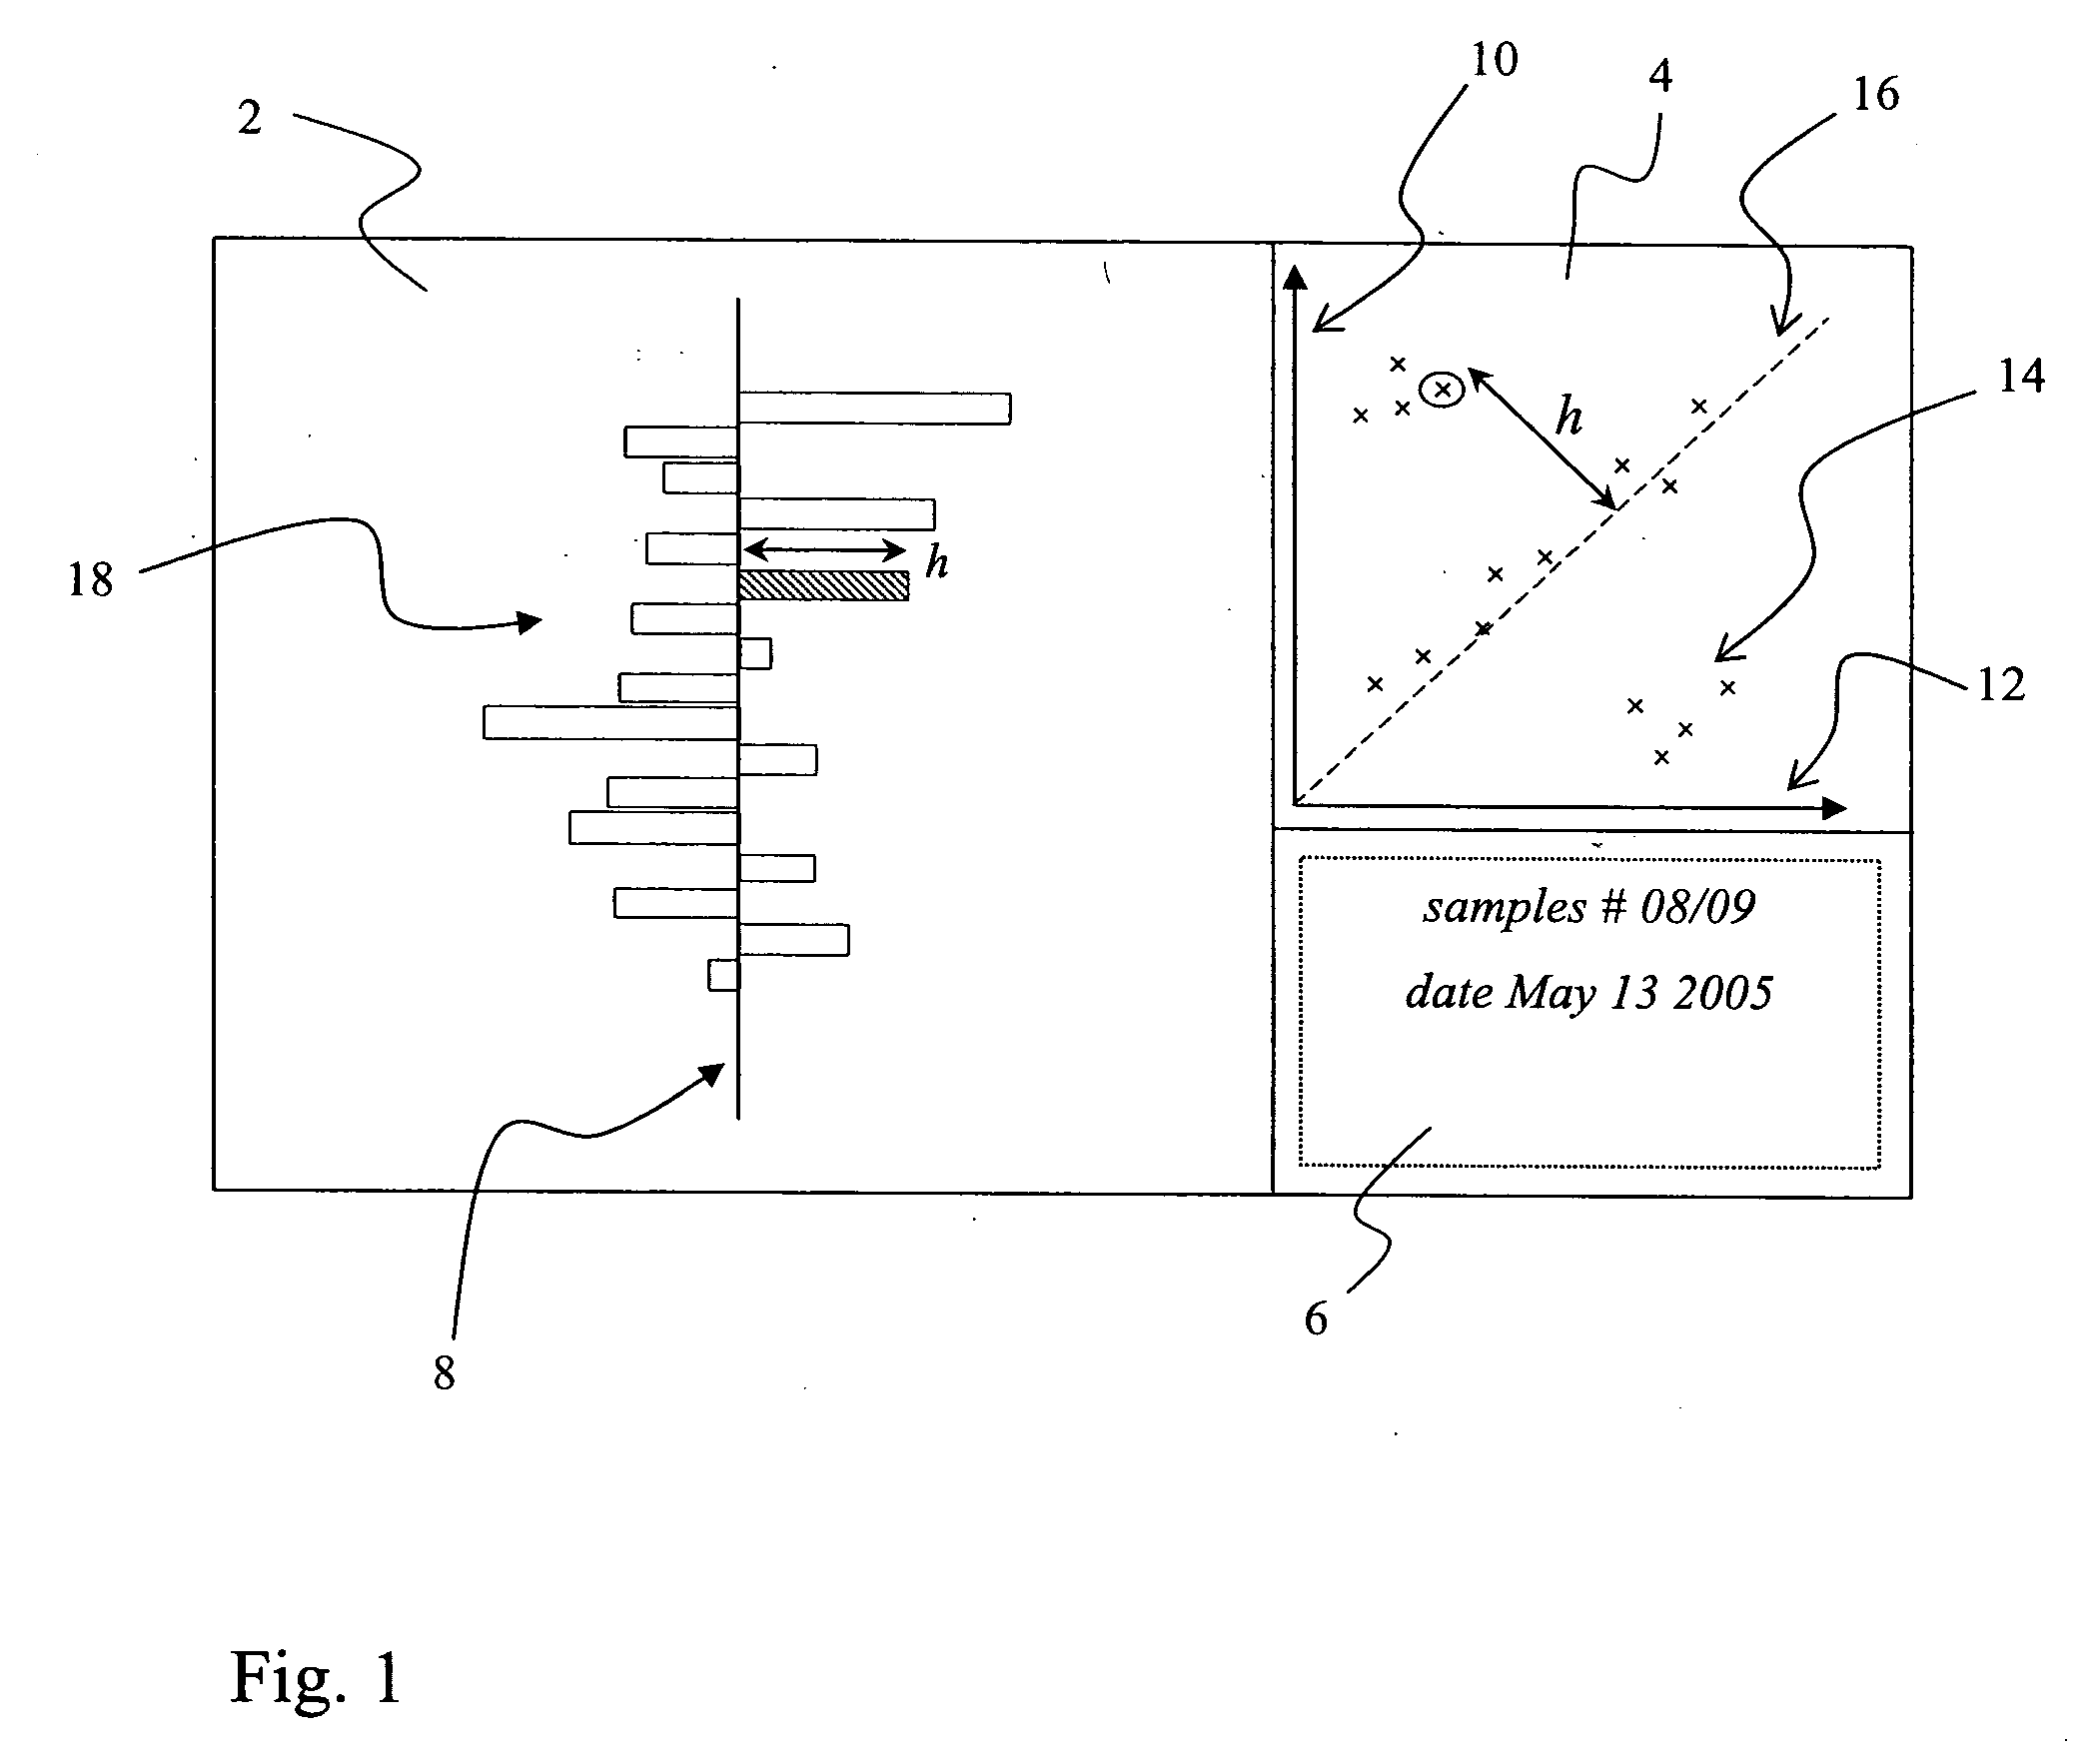
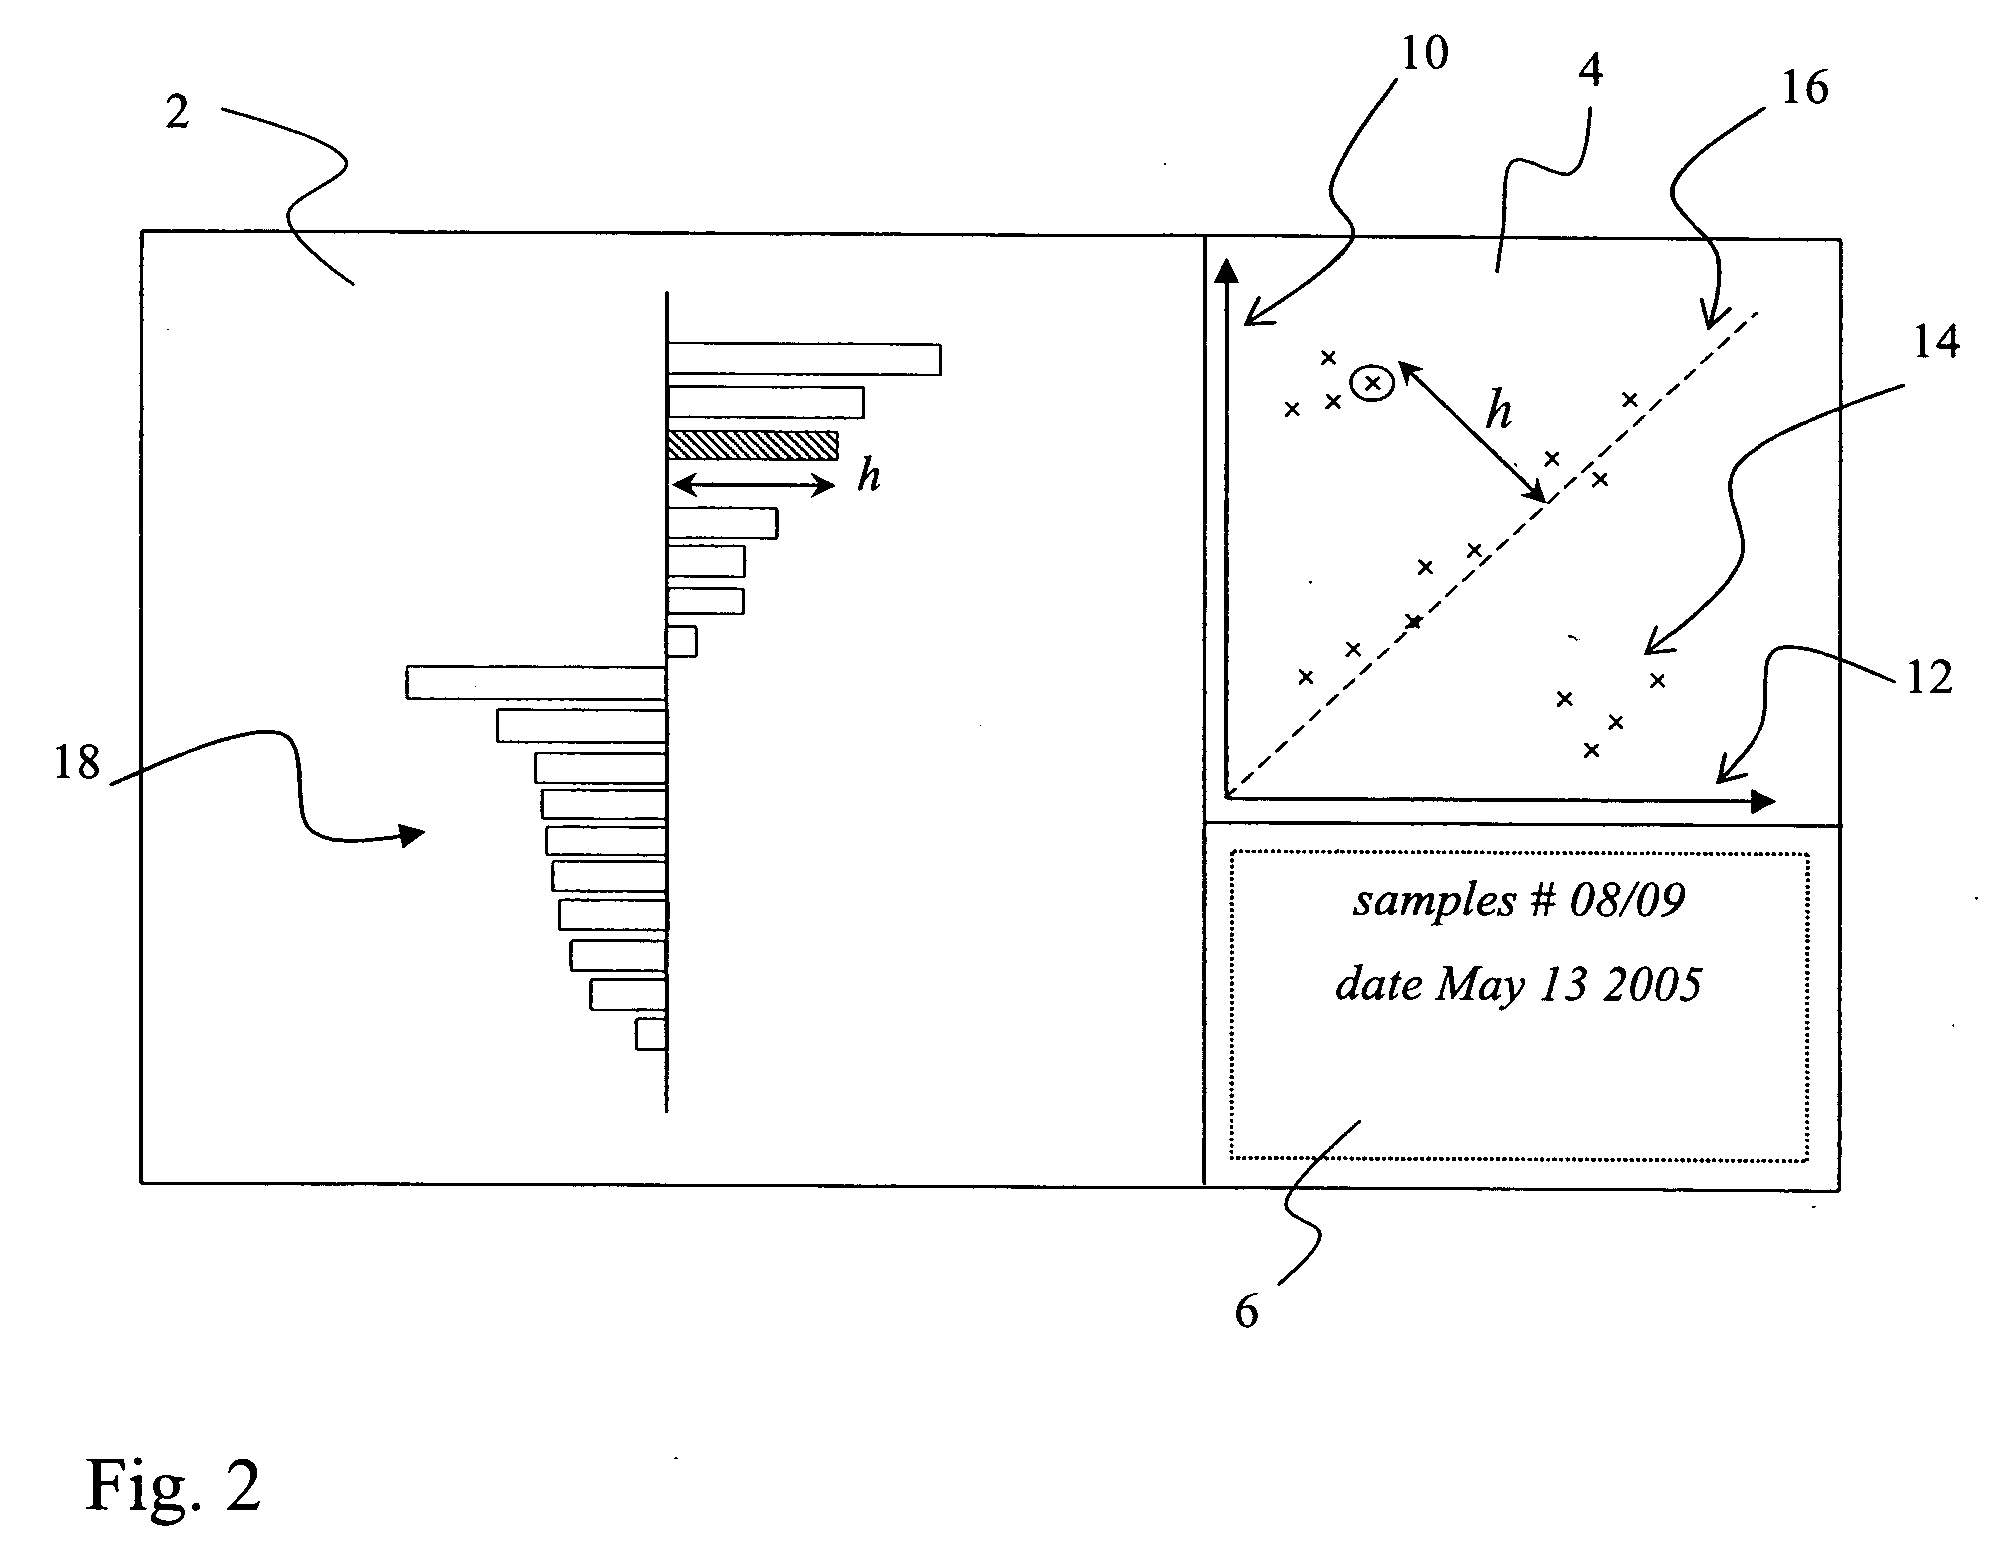
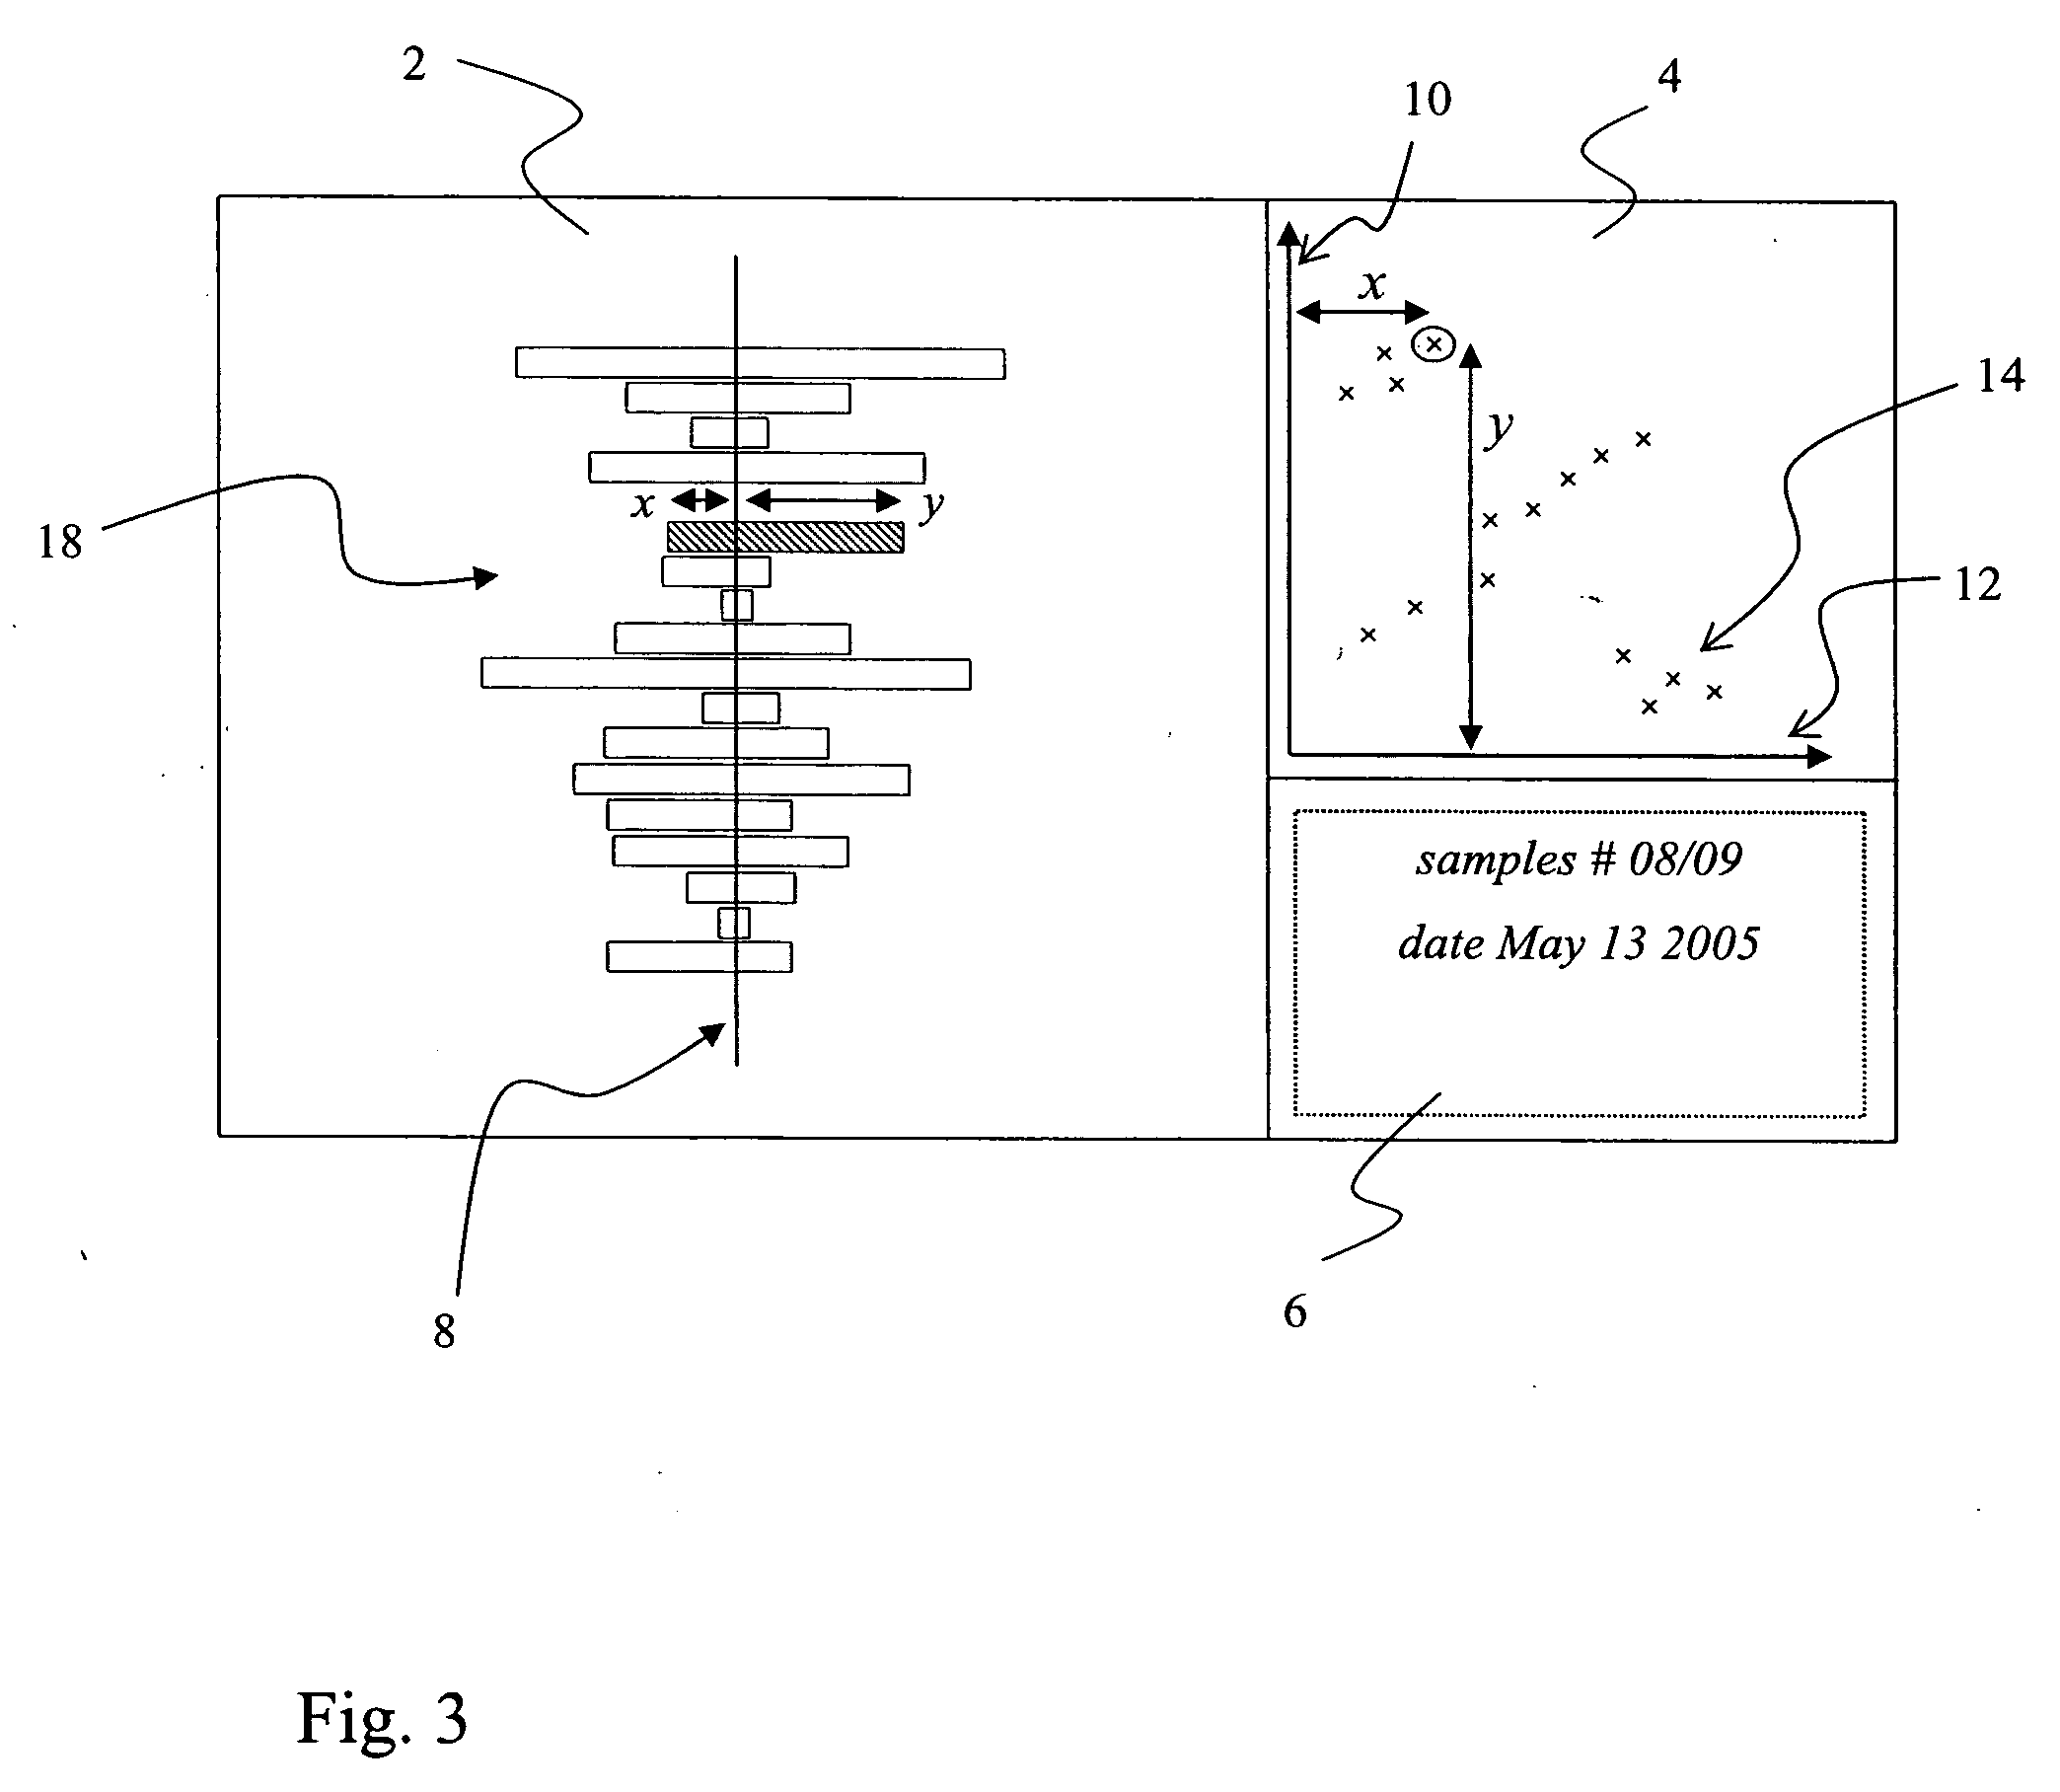
[0149] The computer displays as used in prior art cannot take advantage of split screen data including the use of images from scan results and similar data source. Today, computers and processors allow faster execution of display algorithms. Graphic boards and displays allow faster, more color intensive and larger display formats. The combined effect results in improved work of researchers by delivering an interactive work process.

[0150] Current modern computer displays, for example 16:9 or 16:10 vs. 4:3 as demonstrated by W-XGA or the like, may have wider horizontal dimensions in relation to the vertical axis, thereby being capable to display multiple images at the same time, in a side-by-side manner. Accelerated CPUs, higher memory levels, faster graphics boards and display units, in combination with higher image resolution, can supply the user with multiple images at practically real time, also including more than two data sets at the same time in various kinds of data represent...


PUM


Abstract

Embodiments of computer systems for visualizing information and data from samples, such as nucleic acids, proteins, or other bio-polymers, are disclosed. One embodiment of a method comprises displaying first and second display areas on a display, displaying an axis dividing the first display area into first and second sub-areas, and displaying first and second axes, wherein the axes are substantially perpendicular to each other. The method further comprises displaying a plurality of bar graphs in the first display area, wherein a length of each bar graph in the first sub-area corresponds to the scalar data information of a first biological sample, and a length of each bar graph in the second sub-area corresponds to the scalar data information of a second biological sample; displaying, in the second display area, a plurality of markers, wherein each marker is related to one of the bar graphs.

Description

FIELD OF THE INVENTION [0001] The present invention relates to the field of computer systems for visualizing information and data from samples. The samples may include nucleic acids, proteins or other bio-polymers. BACKGROUND OF THE INVENTION [0002] In biotechnology a high number of experiments is required for drug discovery, for the study of various kinds of interactions between numerous components of a biological system like cells or components of cells, or for the validation of experiments and discoveries. [0003] High throughput approaches increase the number of experiments significantly, yielding huge data volumes to be managed, processed, analyzed and studied. In many applications, the comparison of multiple data sets or experimental data from diverse experiments is required. [0004] In such cases and when the number of data points representing such comparisons exceeds the human capability of rapid or easy appreciation and interpretation, improved visual representation is requir...

Claims


Application Information

Patent Timeline
Patent Type & Authority Applications(United States)
IPC IPC(8): G06F19/00
CPCG06F19/26G16B45/00
Inventor MOHR, GUENTHER
Owner EPPENDORF AG
Why Eureka
Try Eureka