Apparatus and method for dynamic instrumenting of code to minimize system perturbation

a dynamic instrumenting and code technology, applied in the field of apparatus and method for performing traces of program execution, can solve the problems of perturbation of computing systems, invalidation of program execution trace results, and tendencies to perturb the computing system, so as to minimize the number of dynamically inserted hooks and minimize the number of executed hooks

US20070006168A1Inactive Publication Date: 2007-01-04IBM CORP
23 Cites 68 Cited by

Patent Information

Authority / Receiving Office
US · United States
Patent Type
Applications(United States)
Current Assignee / Owner
Publication Date
2007-01-04
Estimated Expiration
Not applicable · inactive patent

Smart Images

  • Figure 1
    Figure 1
  • Figure 2
    Figure 2
  • Figure 3
    Figure 3
Patent Text Reader

Abstract

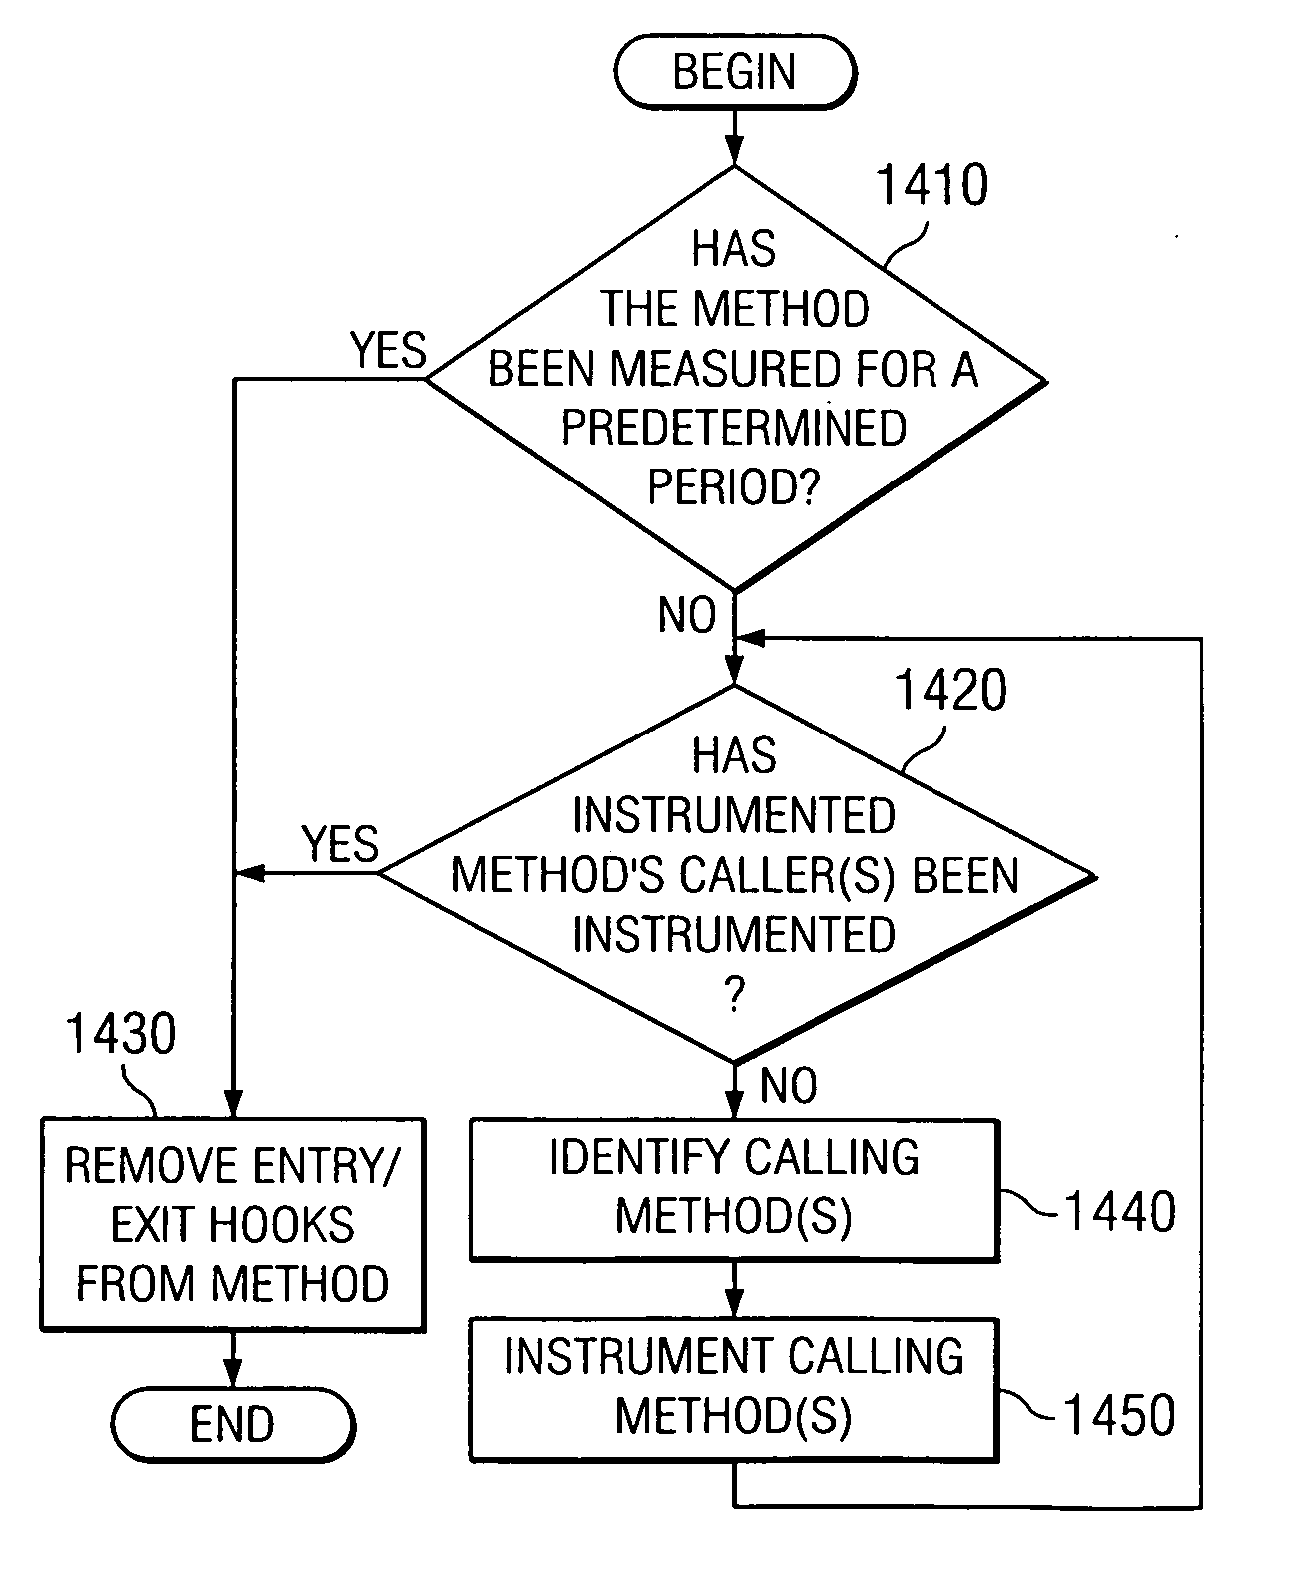
An apparatus and method are provided for the dynamic instrumentation of code to minimize system perturbation during tracing of the execution of the code. With the apparatus and method, “hot spots” in the execution of the code are dynamically determined during tracing of the execution of the code. These “hot spots” are dynamically instrumented, i.e. an event hook is inserted, to cause control to be passed to a handler that determines a caller of the “hot spot” method. The method that called the “hot spot” method, or “caller” method, is identified from a call stack and is dynamically instrumented for an appropriate metric so that the next time the calling method is executed, the dynamically inserted hooks are executed. The execution of the hooks in the caller method is continued for a predetermined period, e.g., number of invocations, to get an understanding of the caller method's characteristics. A list of callers of instrumented methods is maintained and used to determine one or more calling methods of the instrumented caller method. One or more of these calling methods may be instrumented and the hooks inserted in the instrumented caller method (called by the one or more calling methods), are removed. In this way, the call graph of the hot spots of a program execution is “walked up” and characterized over time.
Need to check novelty before this filing date? Find Prior Art

Description

BACKGROUND OF THE INVENTION

[0001] 1. Technical Field

[0002] The present invention is directed to an improved apparatus and method for performing traces of program execution. More specifically, the present invention is directed to an apparatus and method for dynamic insertion of hooks into program code in order to trace the execution of the program code with minimal system perturbation.

[0003] 2. Description of Related Art

[0004] In analyzing and enhancing performance of a data processing system and the applications executing within the data processing system, it is helpful to know which software modules within a data processing system are using system resources. Effective management and enhancement of data processing systems requires knowing how and when various system resources are being used. Performance tools are used to monitor and examine a data processing system to determine resource consumption as various software applications are executing within the data processing system....

Examples

Embodiment Construction

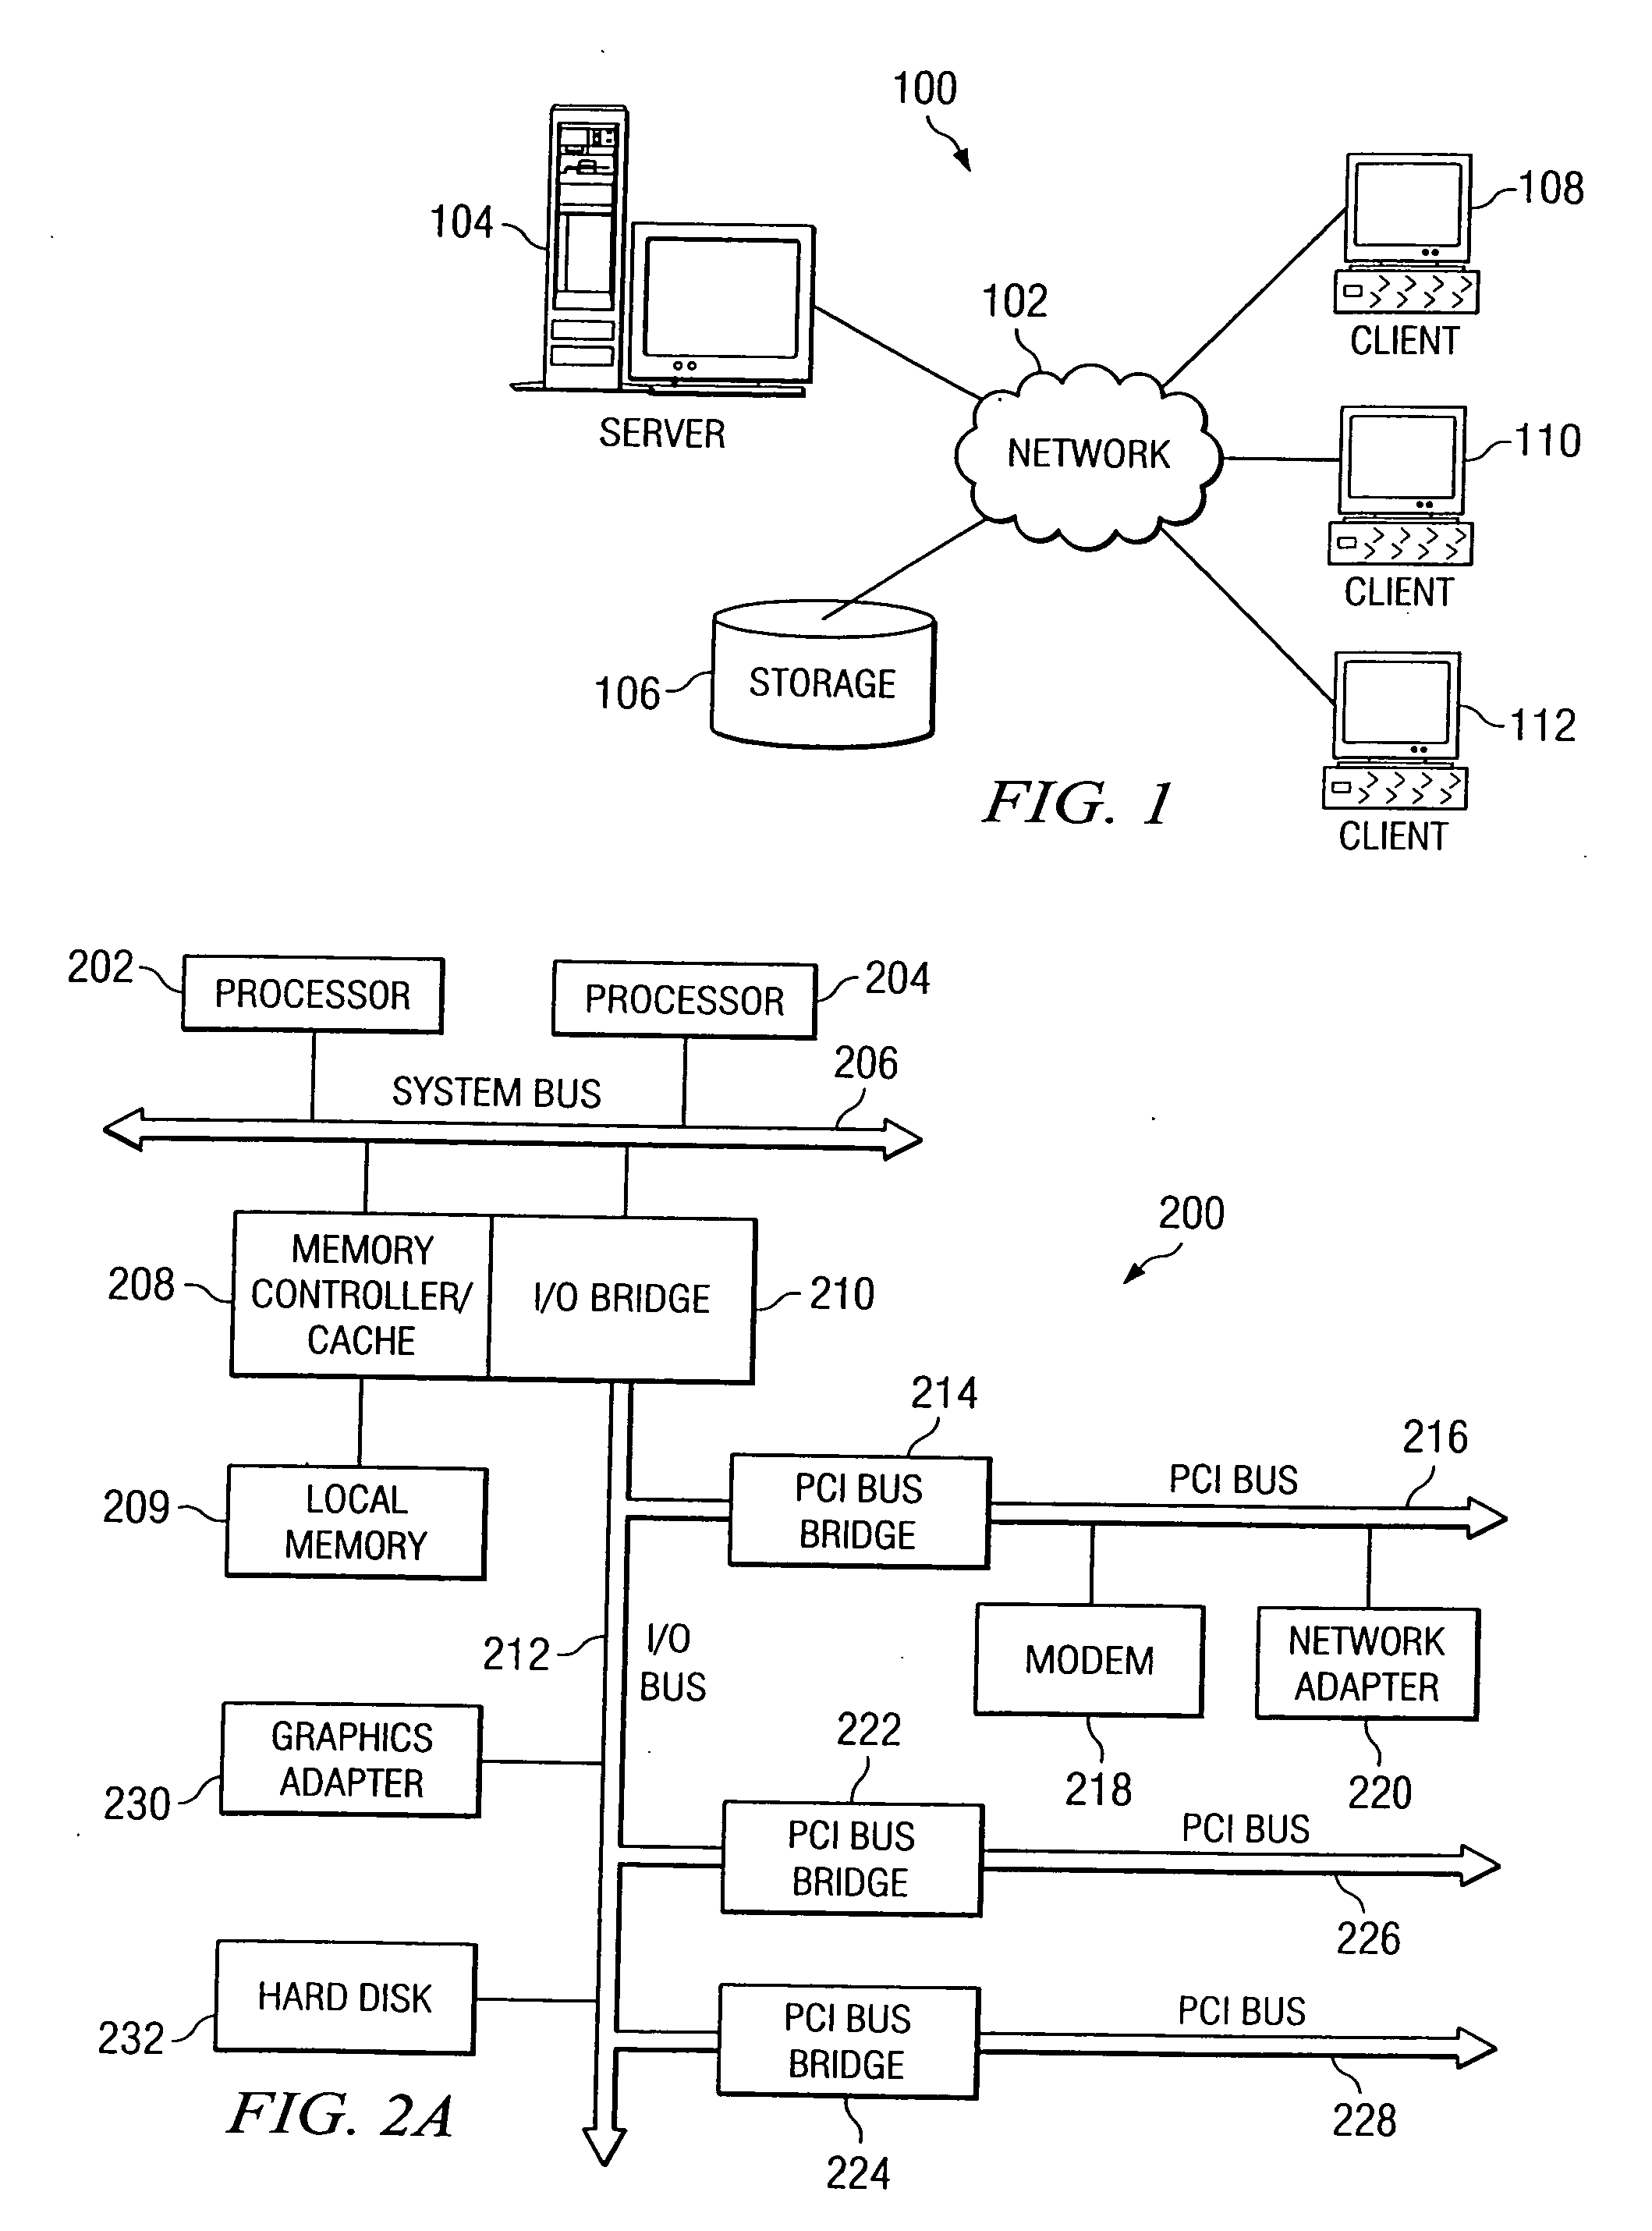
[0034] With reference now to the figures, and in particular with reference to FIG. 1, a pictorial representation of a distributed data processing system in which the present invention may be implemented is depicted. Distributed data processing system 100 is a network of computers in which the present invention may be implemented. Distributed data processing system 100 contains a network 102, which is the medium used to provide communications links between various devices and computers connected together within distributed data processing system 100. Network 102 may include permanent connections, such as wire or fiber optic cables, or temporary connections made through telephone connections.

[0035] In the depicted example, a server 104 is connected to network 102 along with storage unit 106. In addition, clients 108, 110, and 112 also are connected to a network 102. These clients 108, 110, and 112 may be, for example, personal computers or network computers. For purposes of this appl...