Method and system for monitoring fleet metrics
a fleet and metrics technology, applied in the field of methods and systems for monitoring fleet metrics, can solve the problems of limited field services systems provided to fleet managers and conventional fleet management systems that analyze the use of vehicles within fleets
- Summary
- Abstract
- Description
- Claims
- Application Information
AI Technical Summary
Benefits of technology
Problems solved by technology
Method used
Image
Examples
example 1
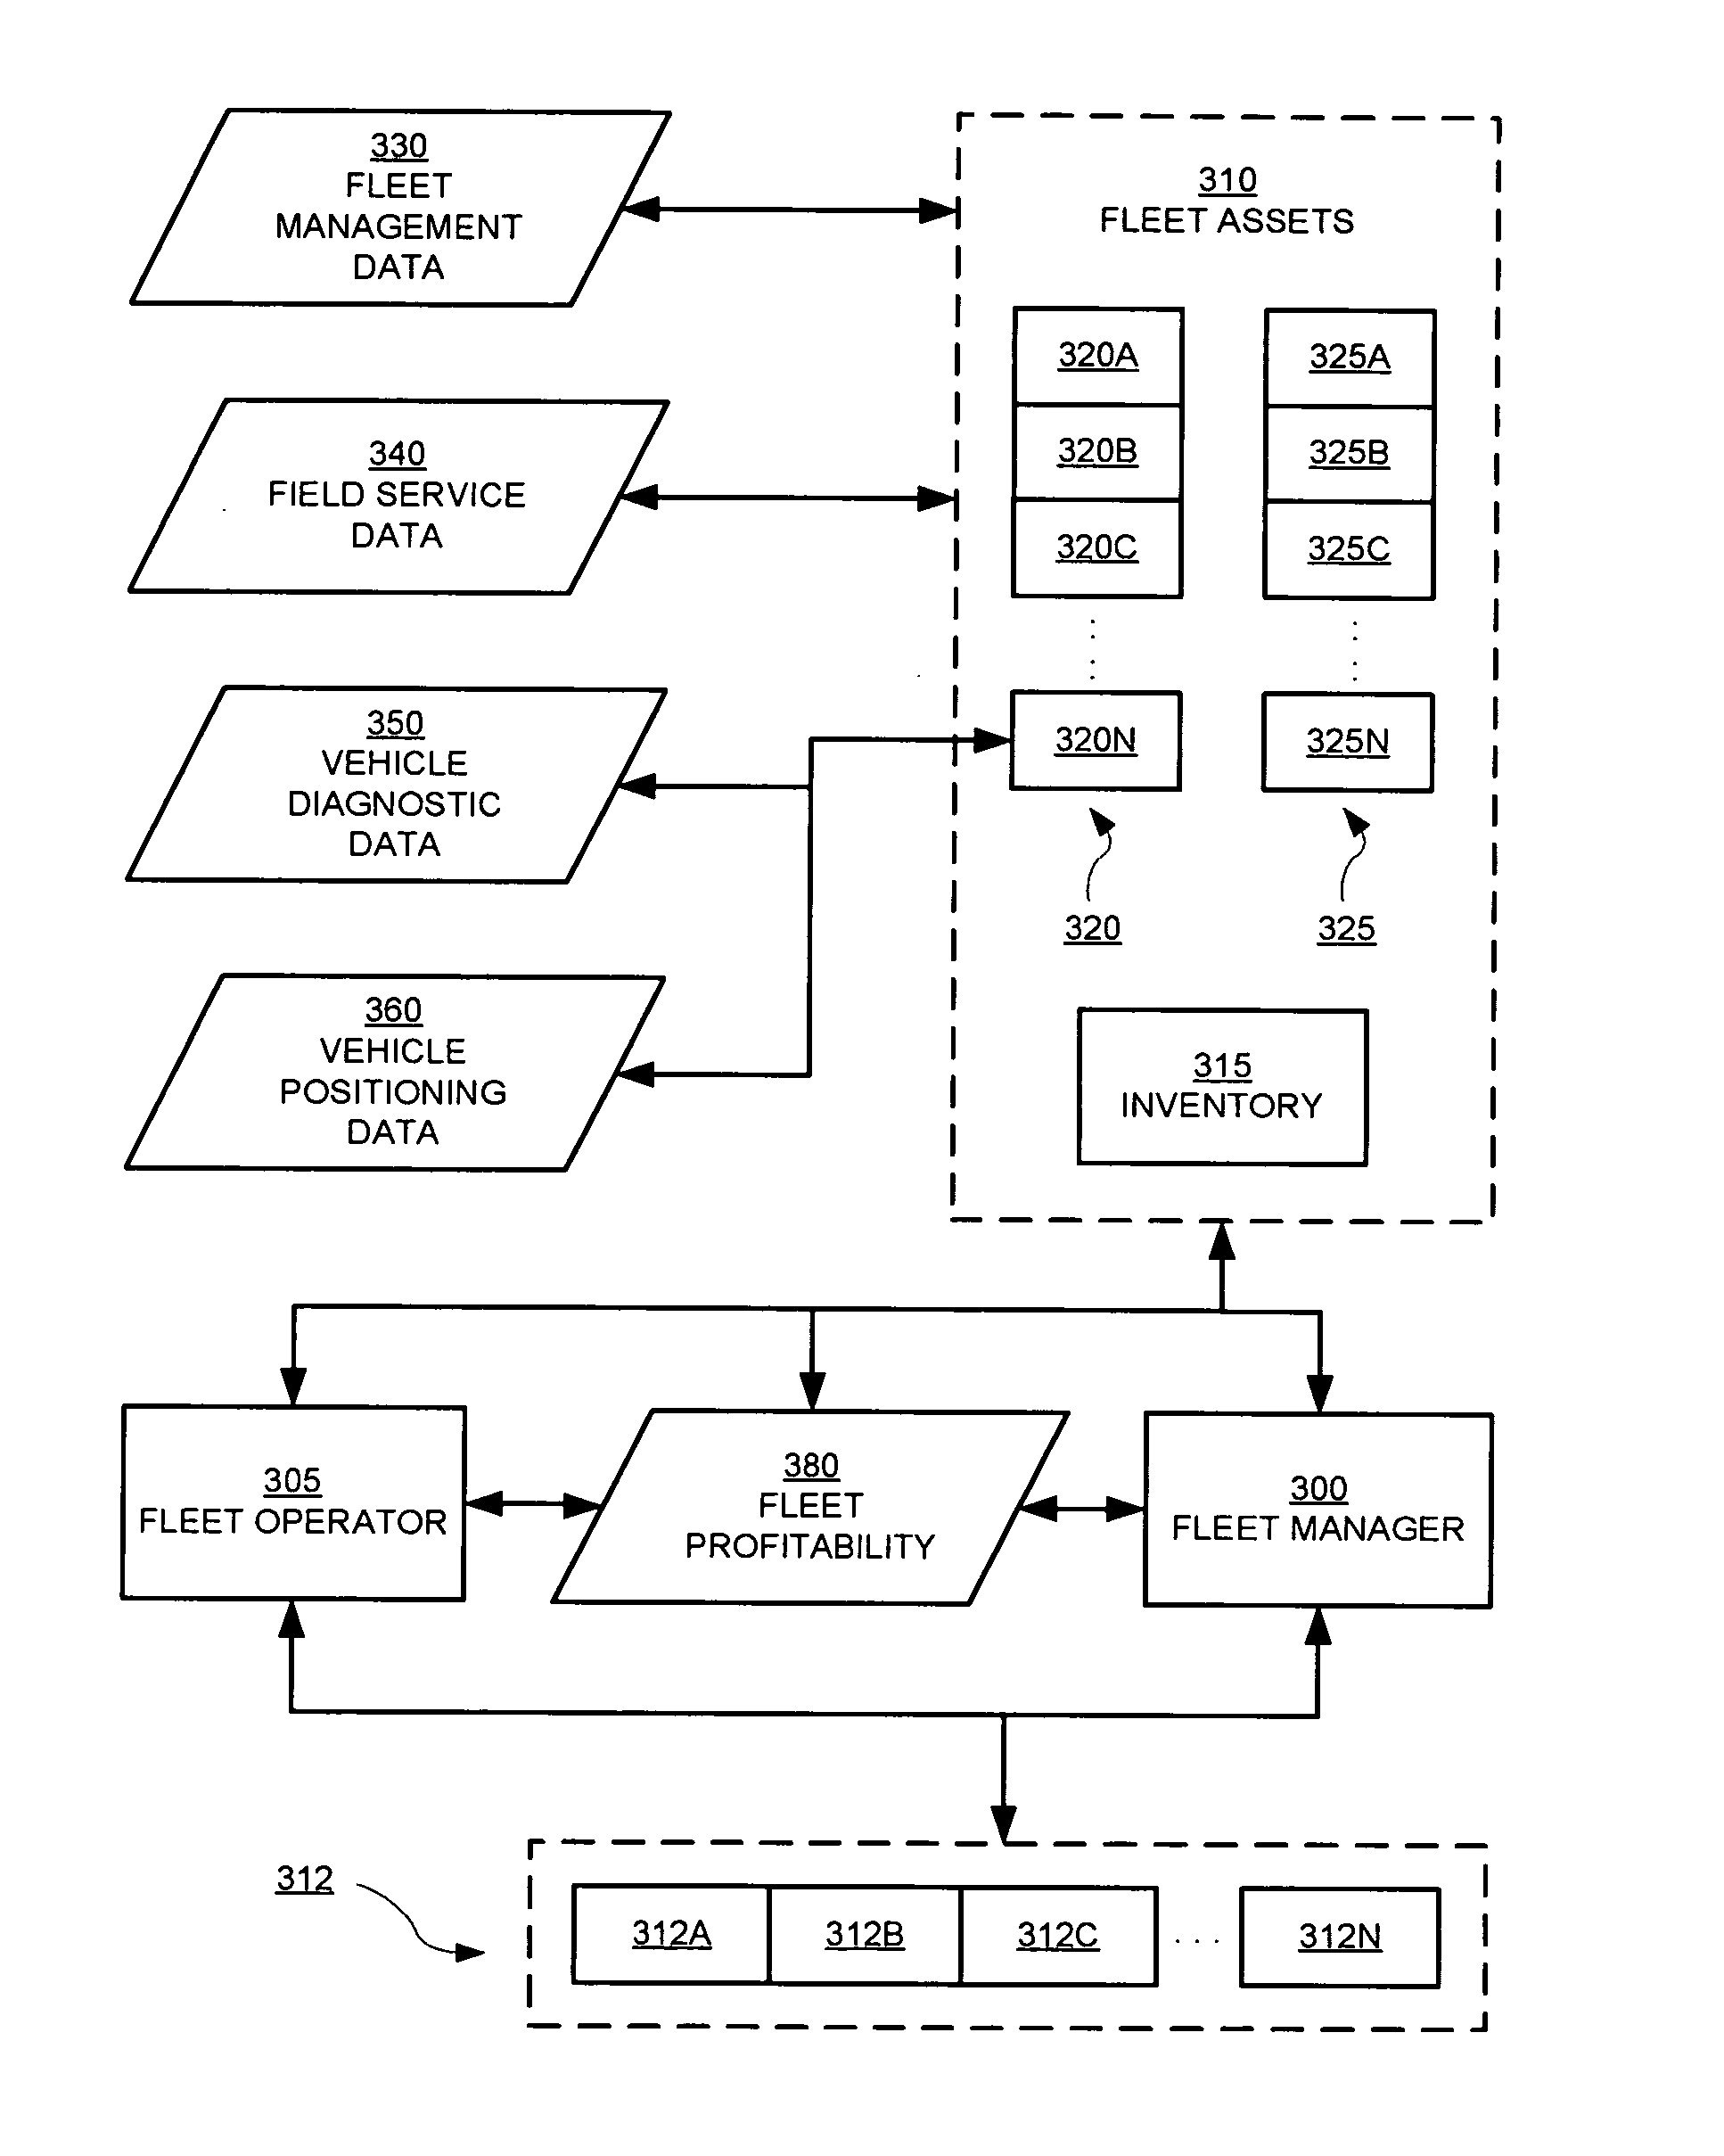
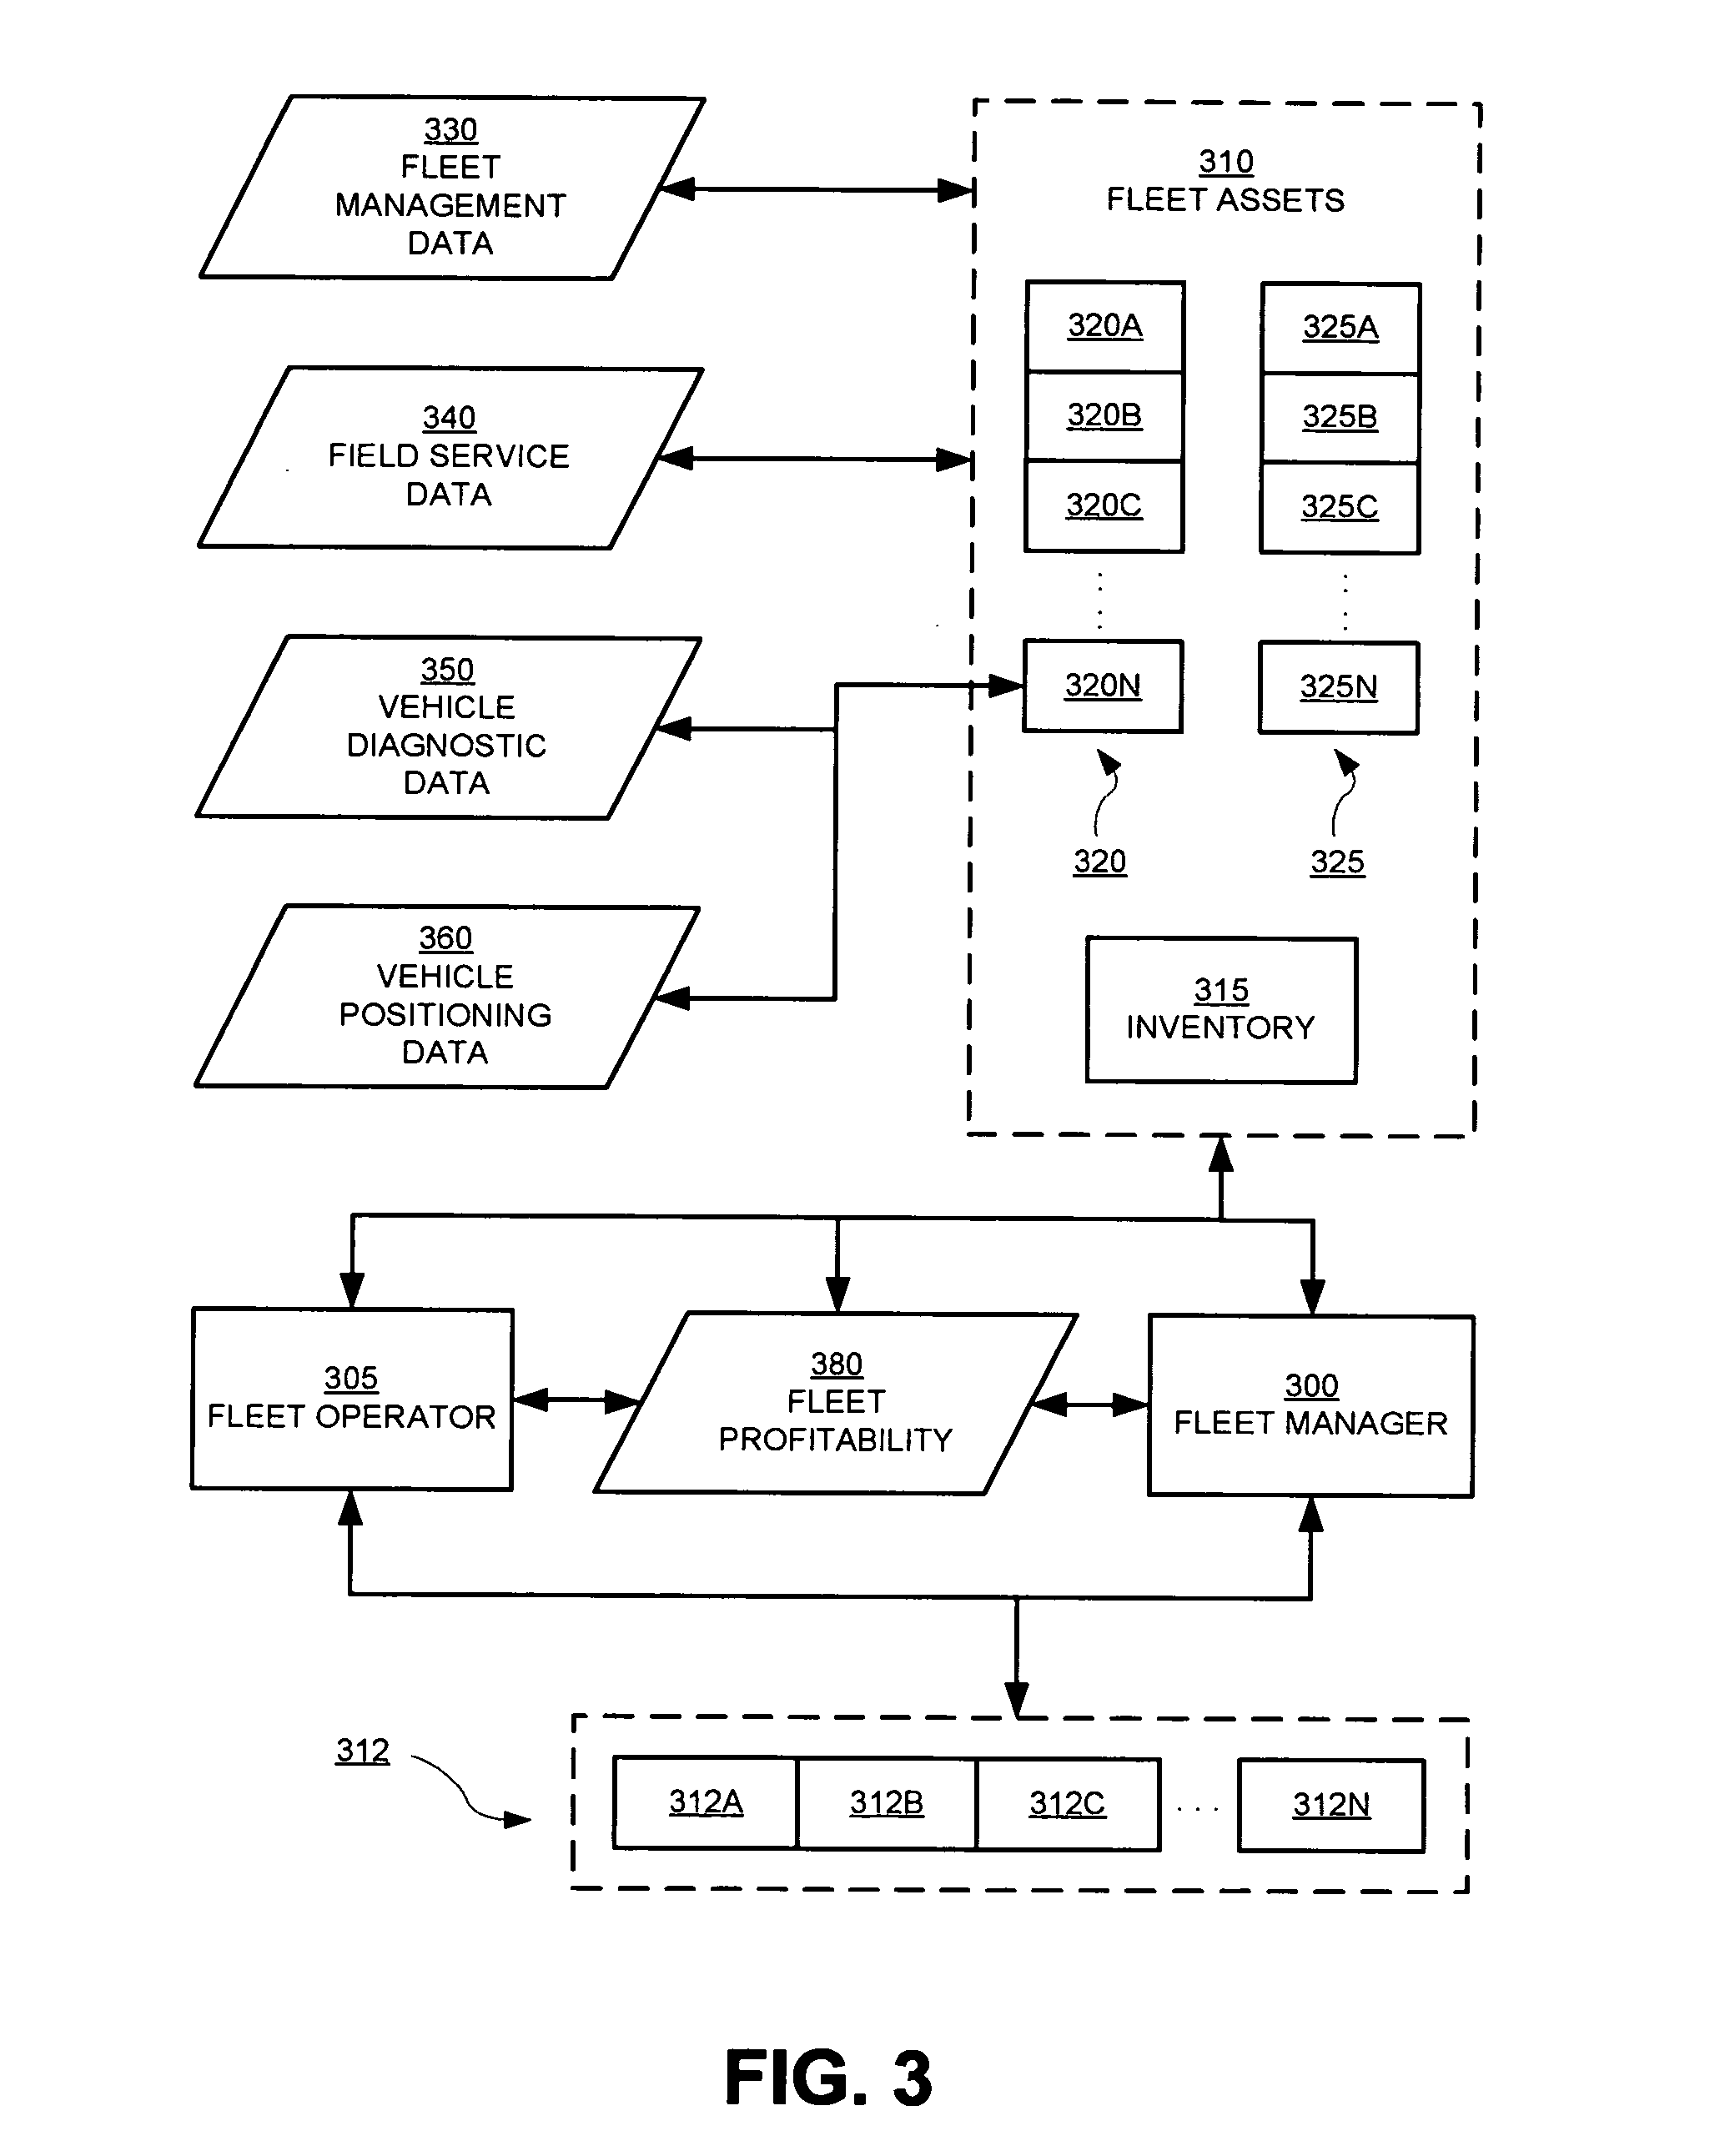
[0111] A fleet manager 300 has a large and dispersed fleet 320, and needs to determine which vehicles 320A-320N are idle, and where these vehicles 320A-320N are. In an illustrative embodiment, an exception 460 (which may be generated in real-time) can identify an unused or idle vehicle 320A of the fleet 320 to the fleet manager 300. A performance indicator 480 for unused vehicles may be calculated using the exception 460; for example, the value of the performance indicator 480 may be the number of vehicles 320A-320N or the percentage of the fleet 320 that is unused or idle. Based upon the exception 460 and / or the performance indicator 480, the portal 490 displays an actionable metric 600 to the fleet manager 300. The fleet manager 300, using the portal 490, can make a user selection (e.g., by clicking on a portion of the actionable metric 600), where the user selection is associated with a detail of the actionable metric 600. Upon receiving the user selection, the portal 490 reports...
example 2
[0113] When a vehicle 320A is driven to a fuel station to fill up, the driver 325A uses a fuel card (e.g., a credit or debit card). In some embodiments, the driver 325A may provide an authorization code and odometer reading to the fuel card provider. The location of the fuel station may be known to the fuel card provider. Prior to authorization of the transaction by the fuel card provider, the actual location of the vehicle 320A is compared to the location of the fuel station. If the locations do not substantially match, fraud is identified; for example, the vehicle 320A may be at its garaging location (e.g., home in the garage of the driver 325A), while the driver 325A attempts to use the fuel card to fuel a second vehicle (e.g., a personally-owned vehicle of the driver 325A). If fraud is identified, the fuel card provider can decline to authorize the transaction, and place a security watch on future usage of the fuel card; in addition, the fuel card provider can cause a fleet mana...
example 3
[0115] A fleet manager 300 faces a queue of field service jobs, calls, or orders, and is responsible for deploying a fleet 320 of service vehicles 320A-320N, resources 325 (e.g., technicians), and inventory 315. Historically, technicians have been assigned to jobs on a first-available first-assigned basis, which produced suboptimal results such as unnecessarily high costs. Using information presented in an actionable metric 600, schedules and routes may be optimized by the fleet manager 300 in real-time, based on data elements such as locations of the vehicles 320A-320N, replacement part inventory 315 on a vehicle 320A, skill sets of the technician 325, shortest routes to the job, and the like. Fleet profitability 180 may be increased by saving money through route optimization (e.g. decreased mileage driven) and schedule optimization (e.g., more jobs per technician 325 per day), while improving customer service levels by guaranteeing the right technician 325 with the right skill set...
PUM
 Abstract
Description
Claims
Application Information
 - R&D
- Intellectual Property
- Life Sciences
- Materials
- Tech Scout
- Unparalleled Data Quality
- Higher Quality Content
- 60% Fewer Hallucinations
Browse by: Latest US Patents, China's latest patents, Technical Efficacy Thesaurus, Application Domain, Technology Topic, Popular Technical Reports.
© 2025 PatSnap. All rights reserved.Legal|Privacy policy|Modern Slavery Act Transparency Statement|Sitemap|About US| Contact US: help@patsnap.com


